EAPS Displays on the fourth floor of the HAMP building
Fourth Floor
What's there?
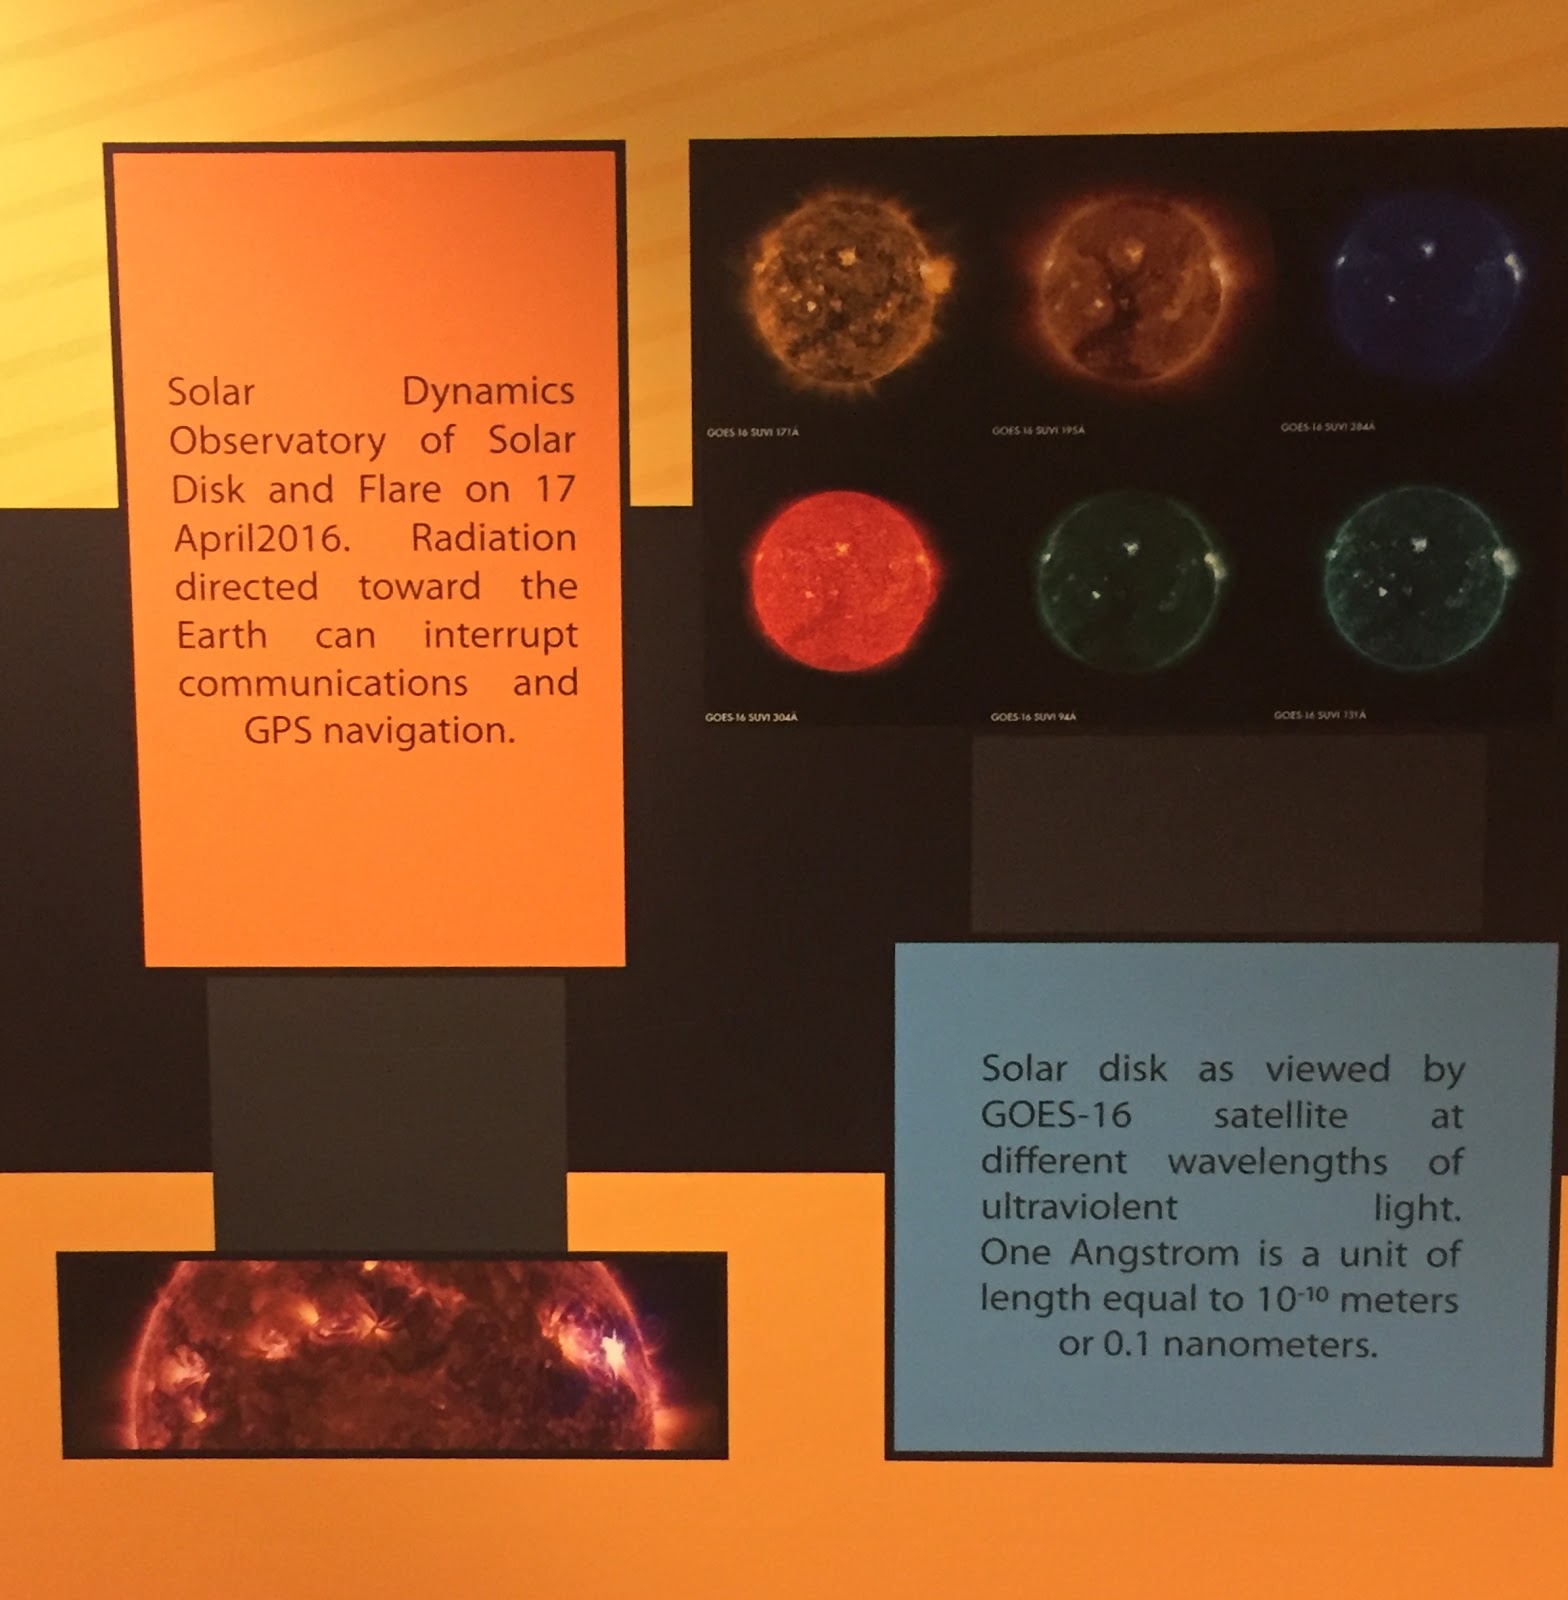
On the right, the GOES-16 satellite depicts solar disk at different wavelengths of ultraviolet light. Radiation that is Earth-bound can interrupt GPS navigation and various communications.
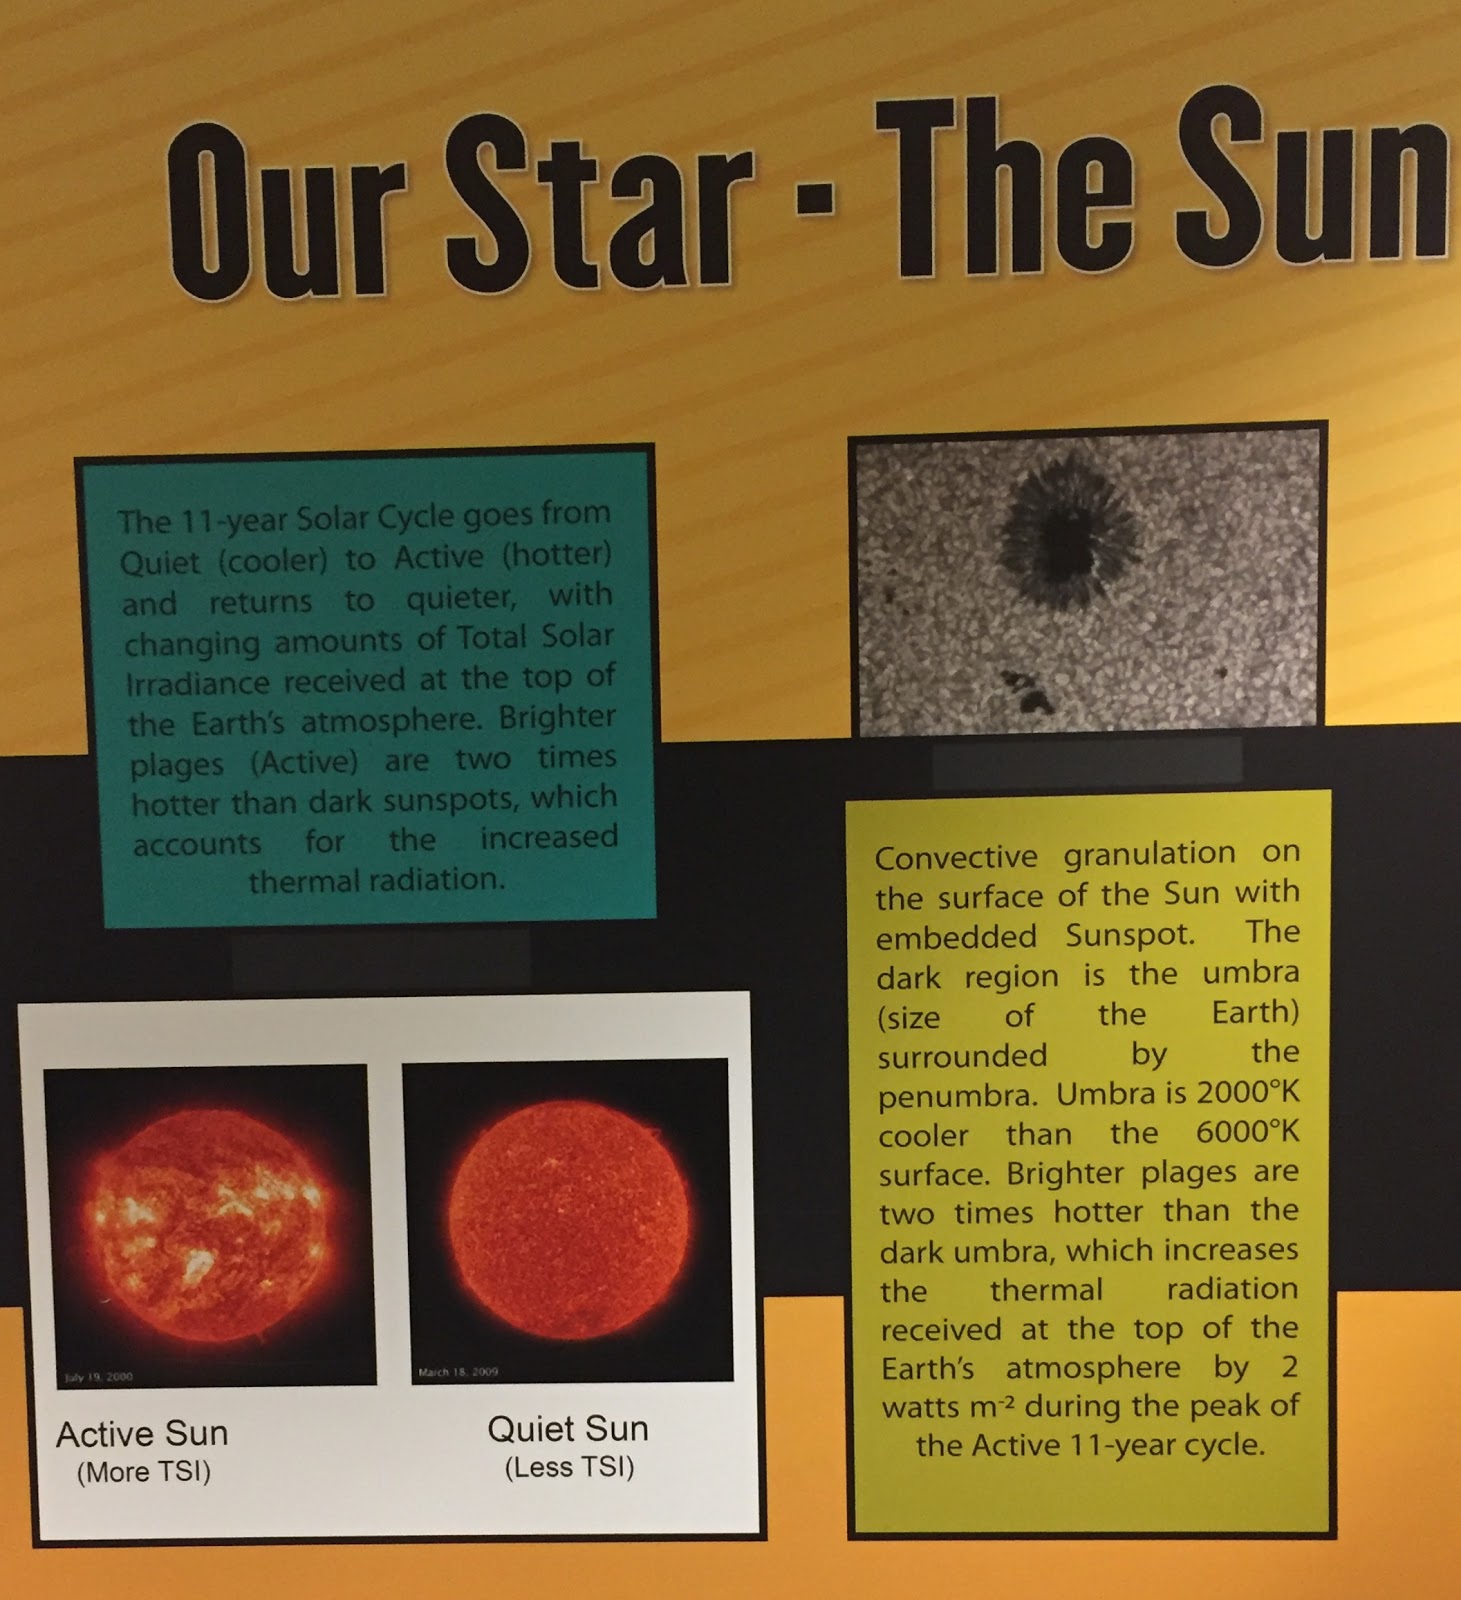
One of the Solar Cycles the Sun experiences is the 11-year Solar Cycle. In this cycle, the Sun alternates from a cool, quiet Sun to an active, hot Sun. The Total Solar Irradiance (TSI) fluctuates with the shift from quiet to active Sun. The photo on the right depicts a sunspot. The brighter places are extremely hot while the dark spot (known as the umbra) is much cooler. The cool umbra is surrounded by a slightly warmer penumbra.
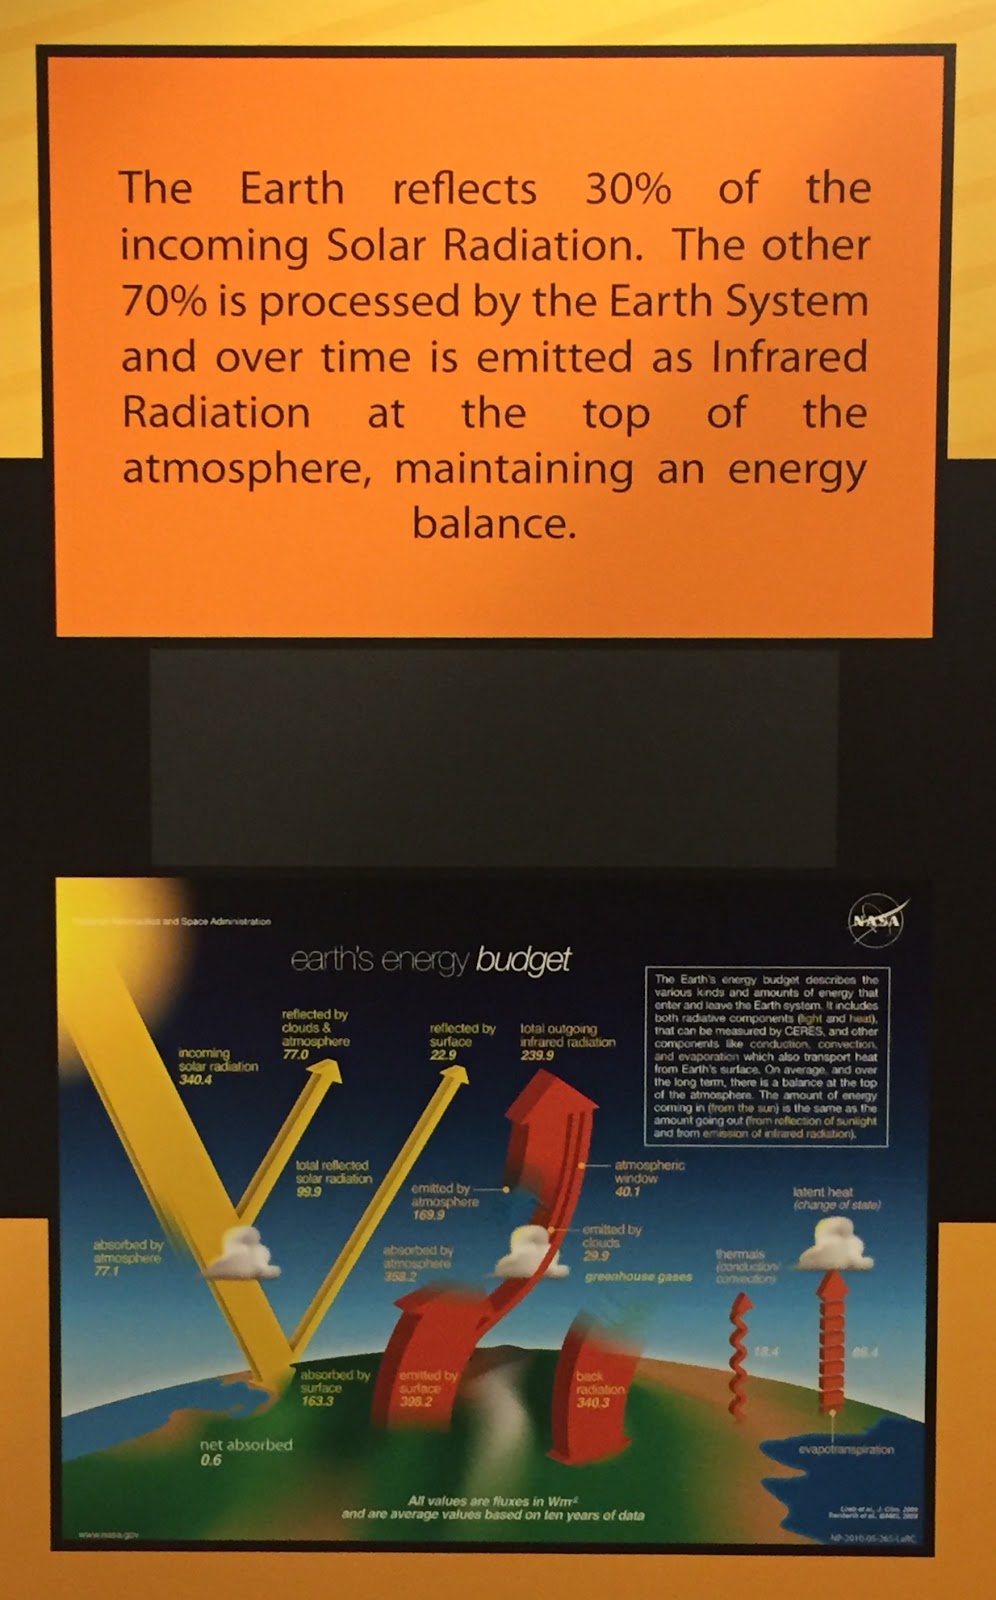
Seventy percent of the solar radiation that hits Earth is processed by the Earth System, eventually emitted as infrared radiation at the top of the atmosphere. The remaining thirty percent of the incoming solar radiation is reflected back out into space. Earth’s energy budget is how various kinds and values of energy that enter and leave the Earth system (such as, but not limited to, convection, radiative components, and evaporation).
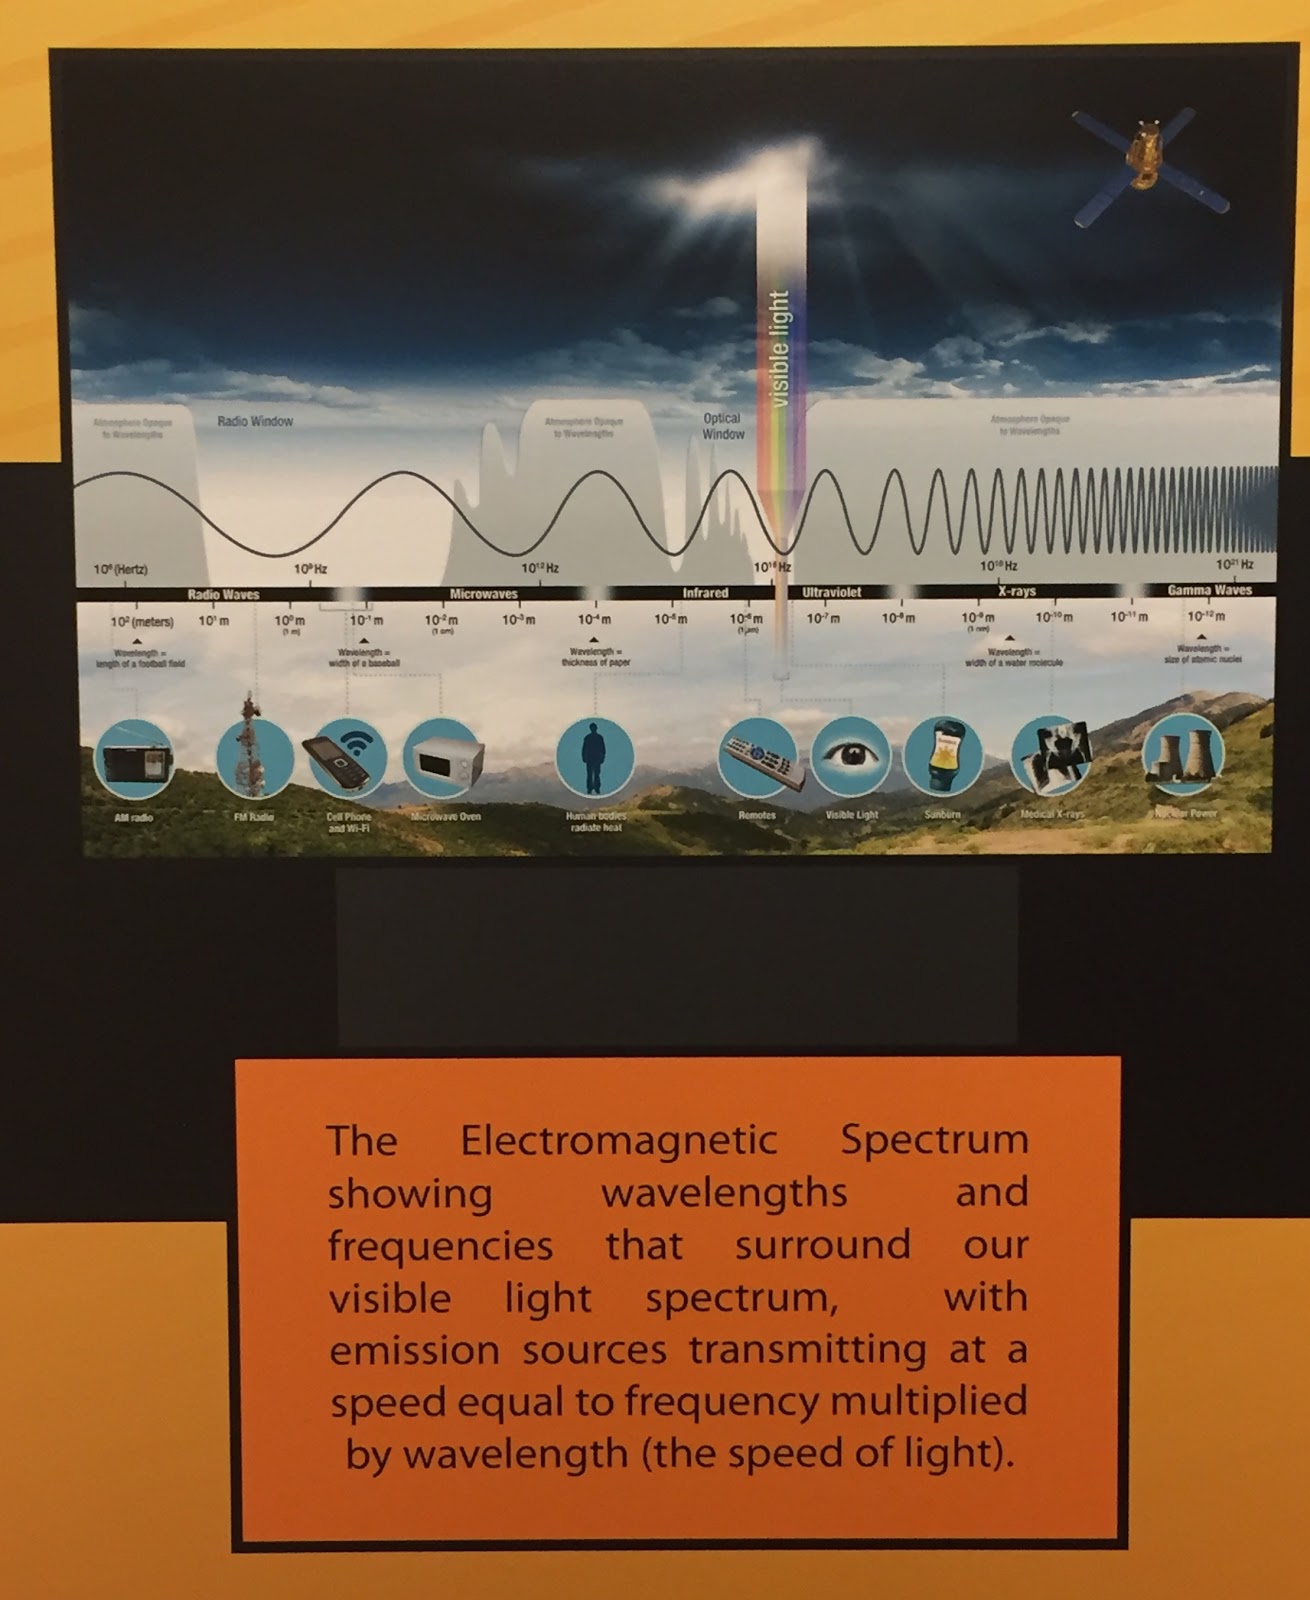
This photo depicts the electromagnetic spectrum. On this spectrum are the wavelengths and frequencies that surround the visible light spectrum. From longest wavelengths to shortest, the spectrum is as follows: radio waves, microwaves, infrared, visible light, ultraviolet, x-rays, and gamma waves.
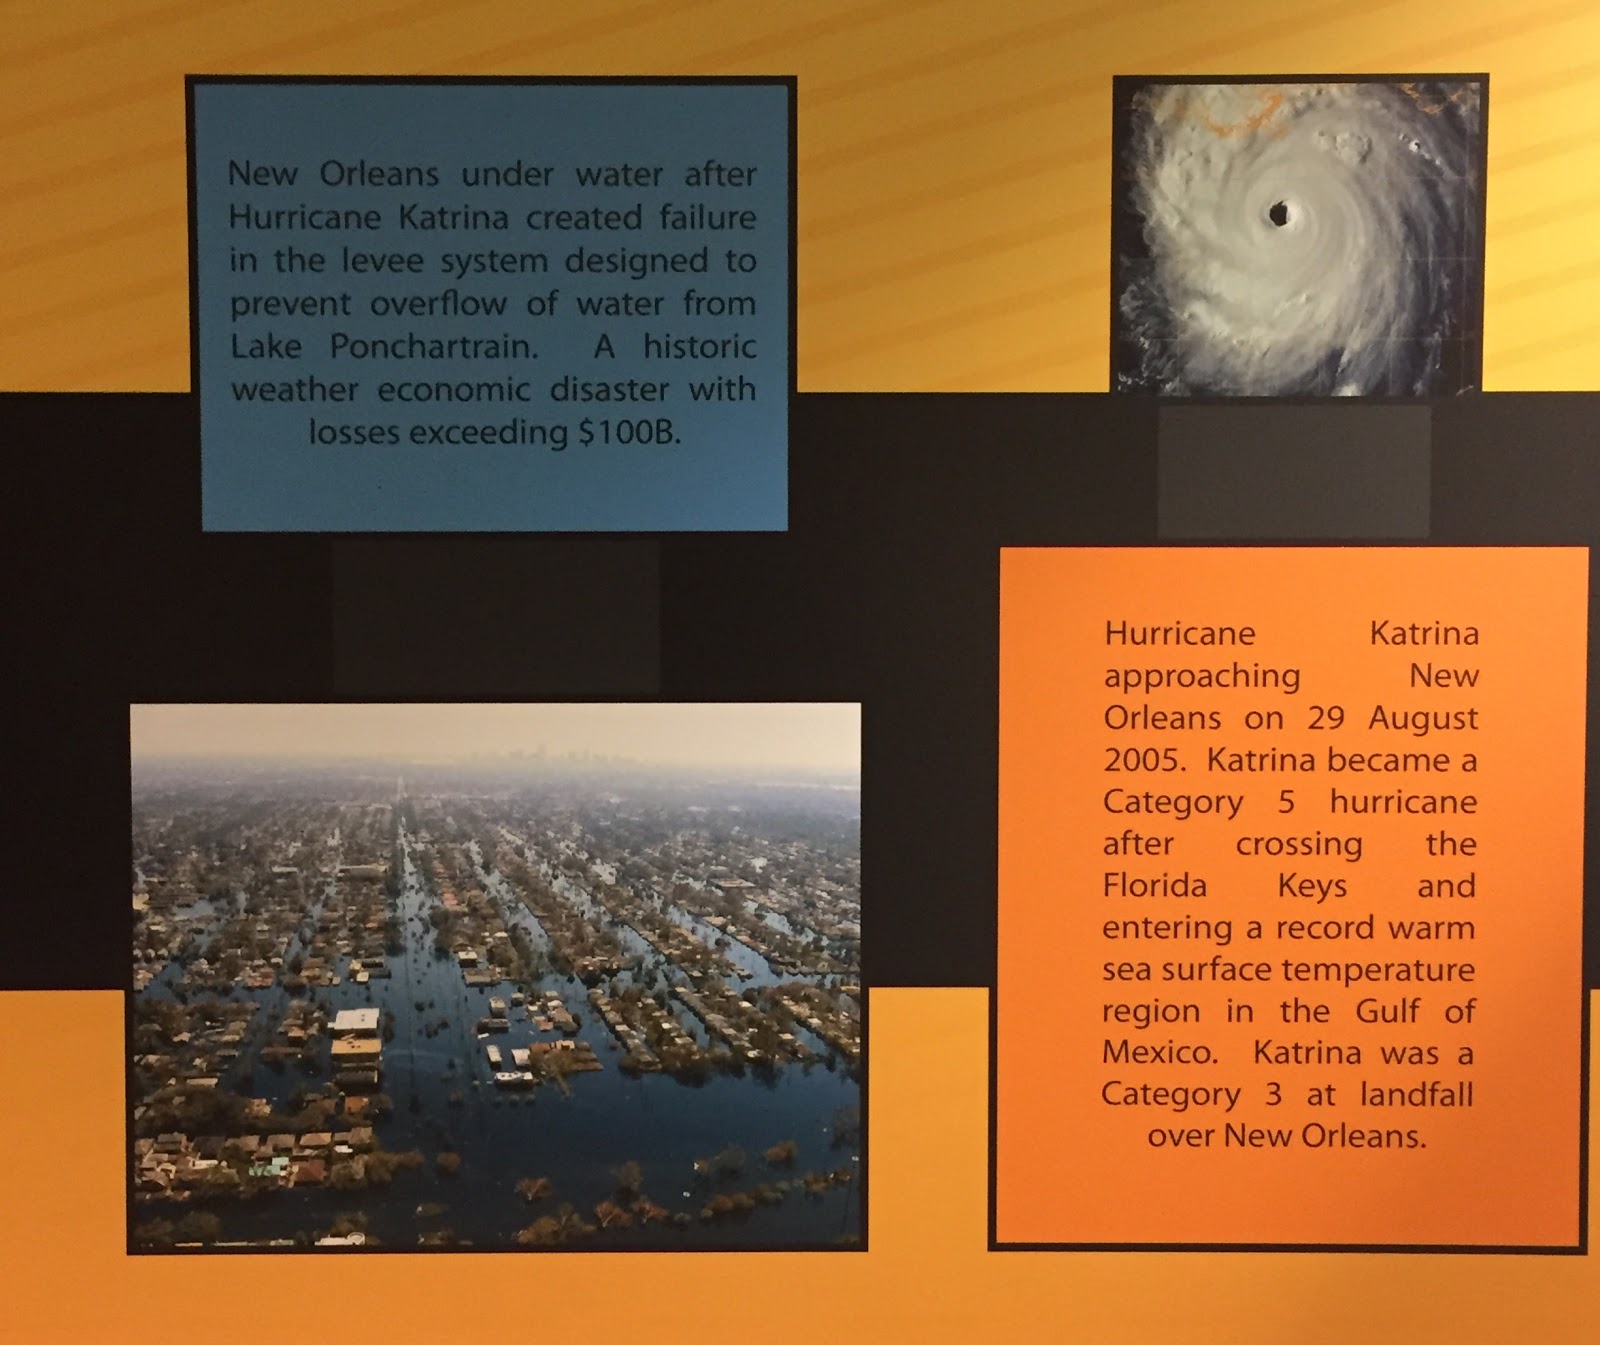
Hurricanes are extremely destructive forces of nature. One prime example of such destruction would be the 2005 Hurricane Katrina- there was more than one hundred billion dollars worth of damages and the city of New Orleans was left underwater.
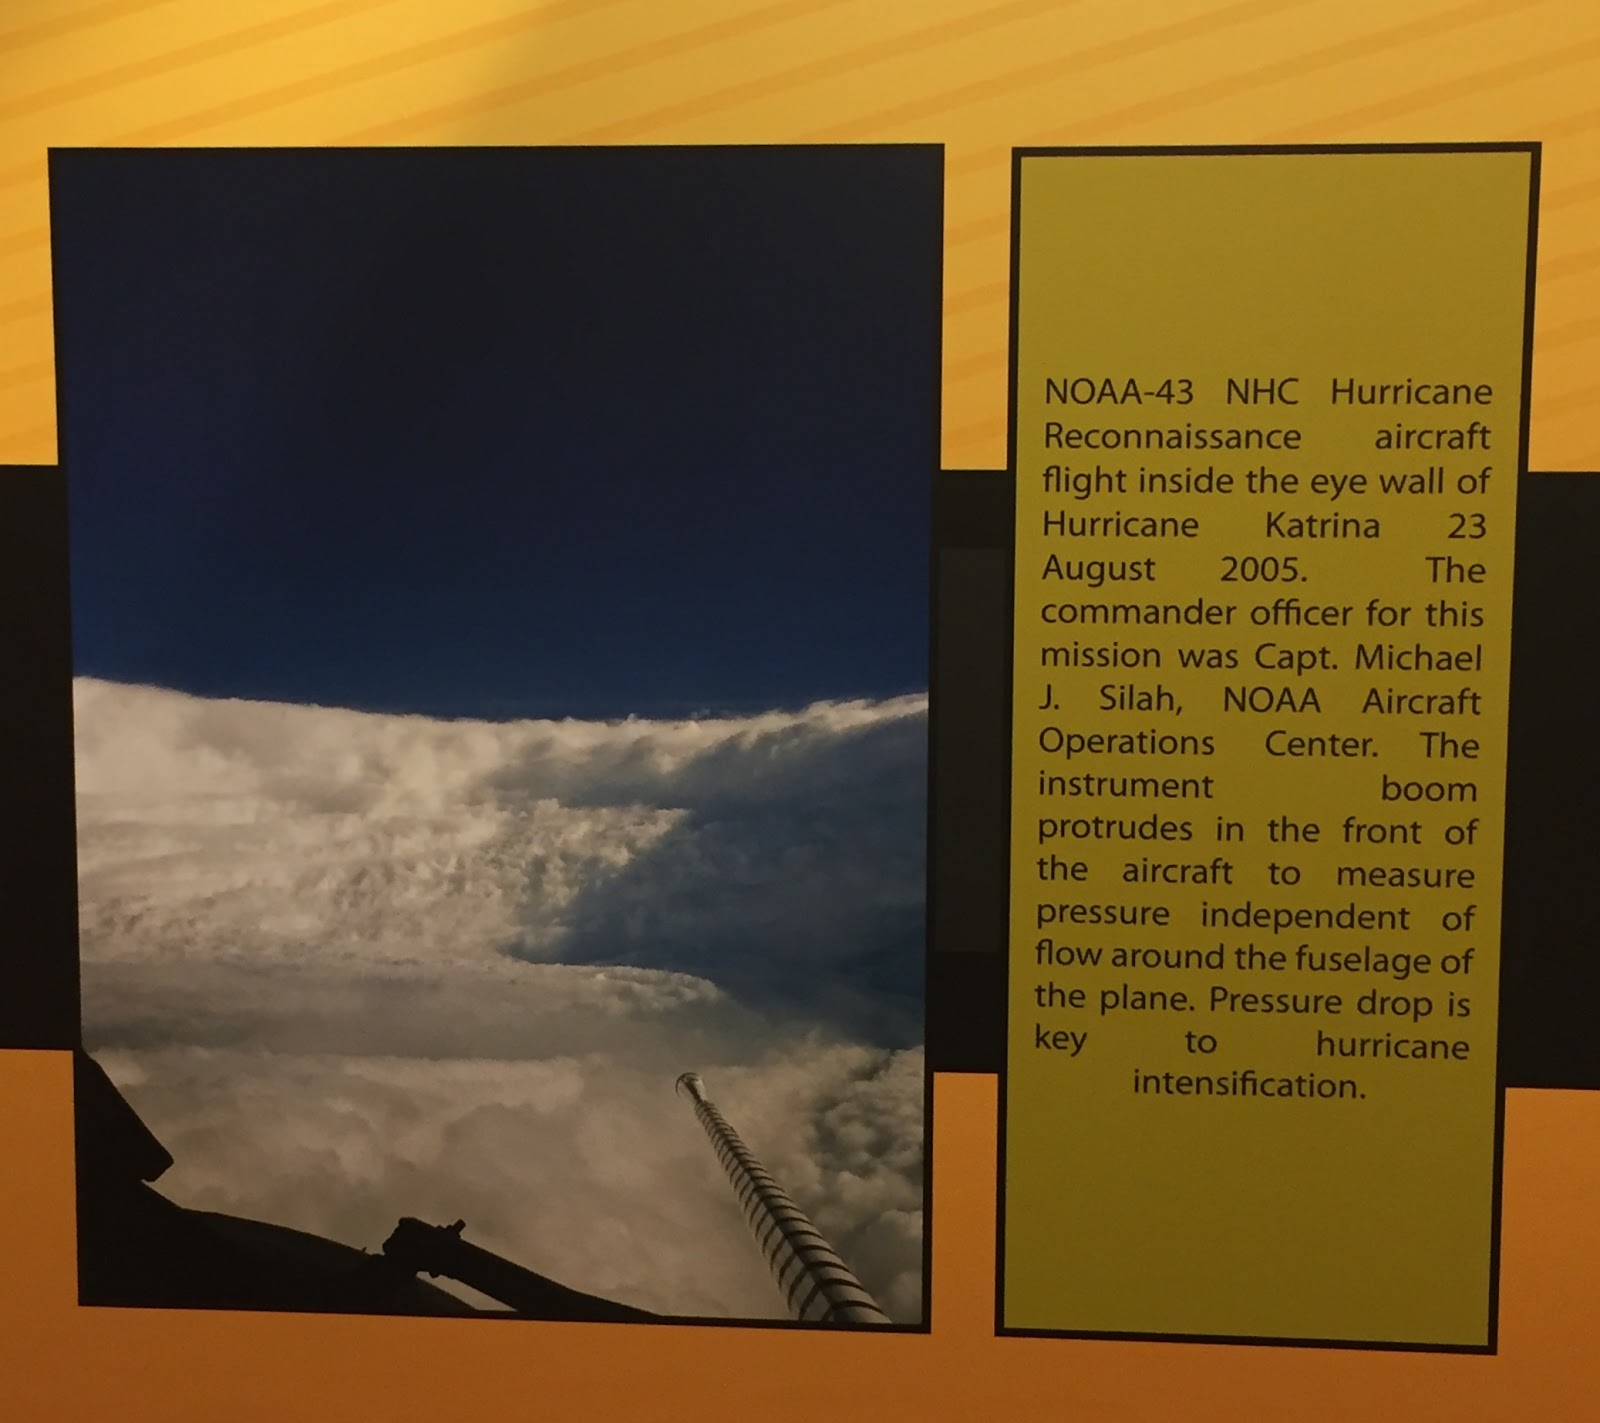
This is a photo of the inside of the eyewall of Hurricane Katrina. During this flight, pressure independent of flow around the fuselage of the plane was measured because pressure drop is incredibly important to hurricane intensification.
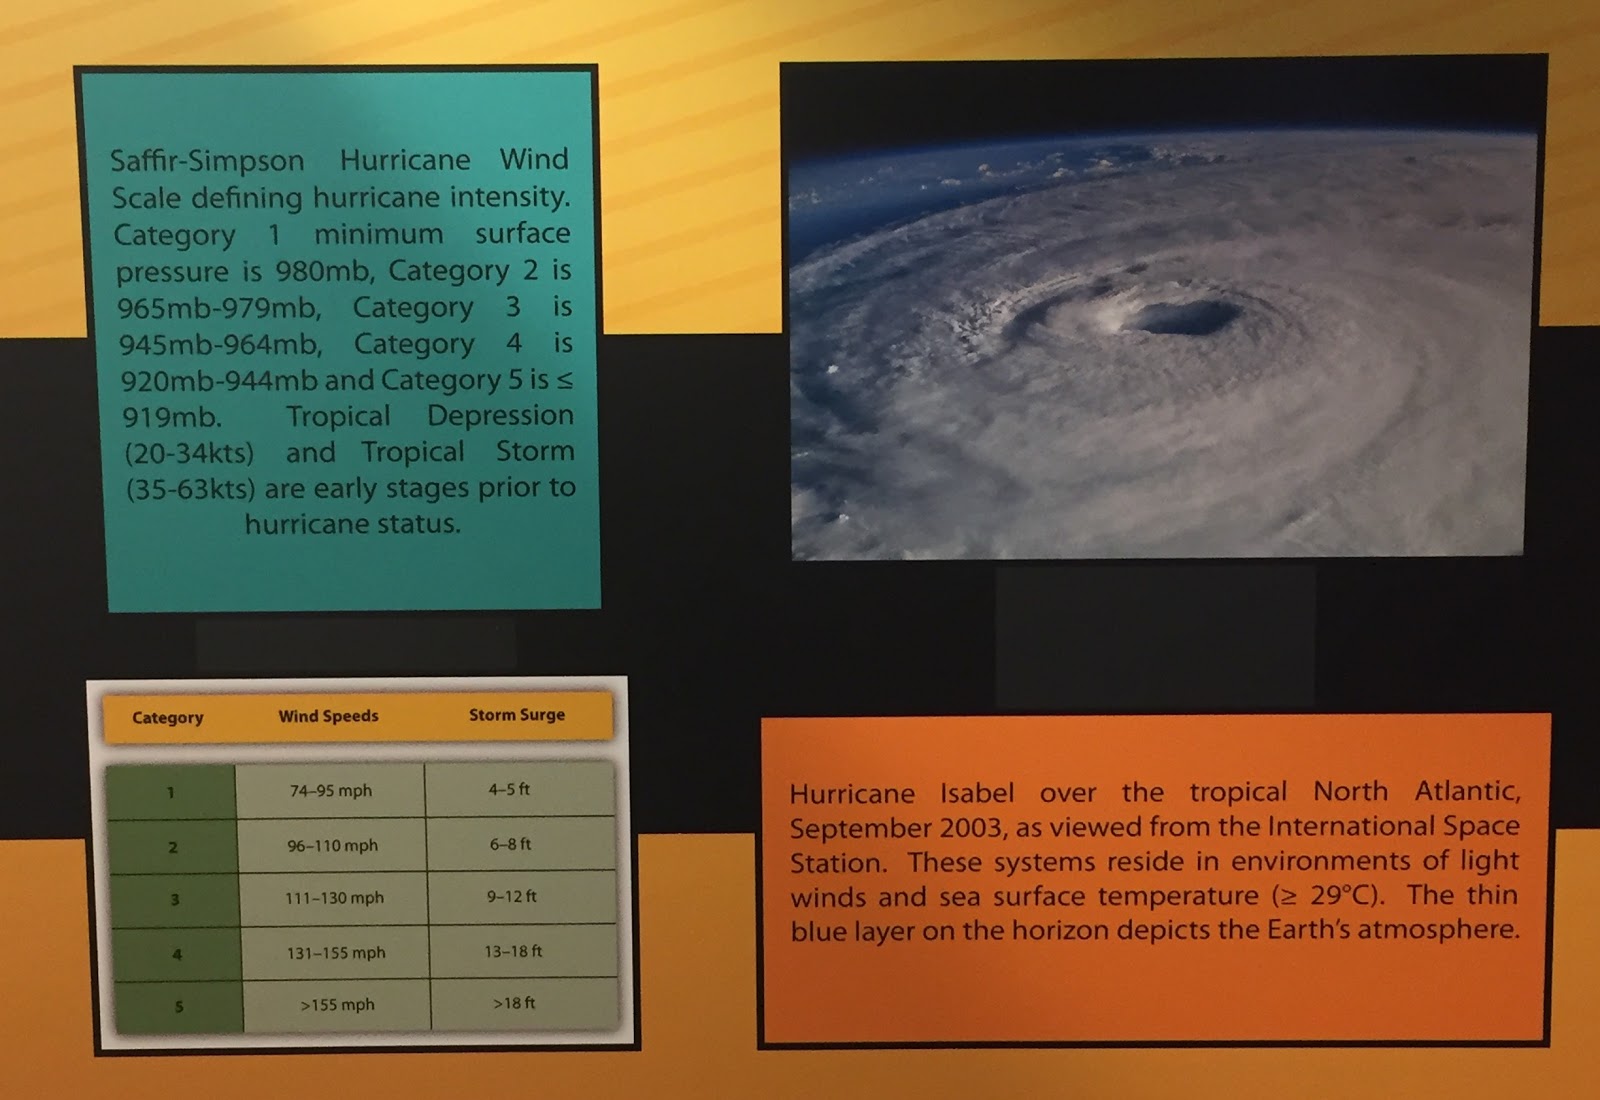
Much like tornadoes, hurricanes also have strength levels given to them. For example, a category one hurricane as wind speeds ranging from seventy-four to ninety-five miles per hour, a storm surge of four to five feet, and the minimum surface pressure is nine-hundred eighty millibars. A category five hurricane, however, has wind speeds greater than one-hundred fifty-five miles per hour, a storm surge of exceeding eighteen feet, and a minimum surface pressure of less than or equal to nine-hundred nineteen millibars. Tropical depressions and tropical storms are what happen prior to hurricane status.
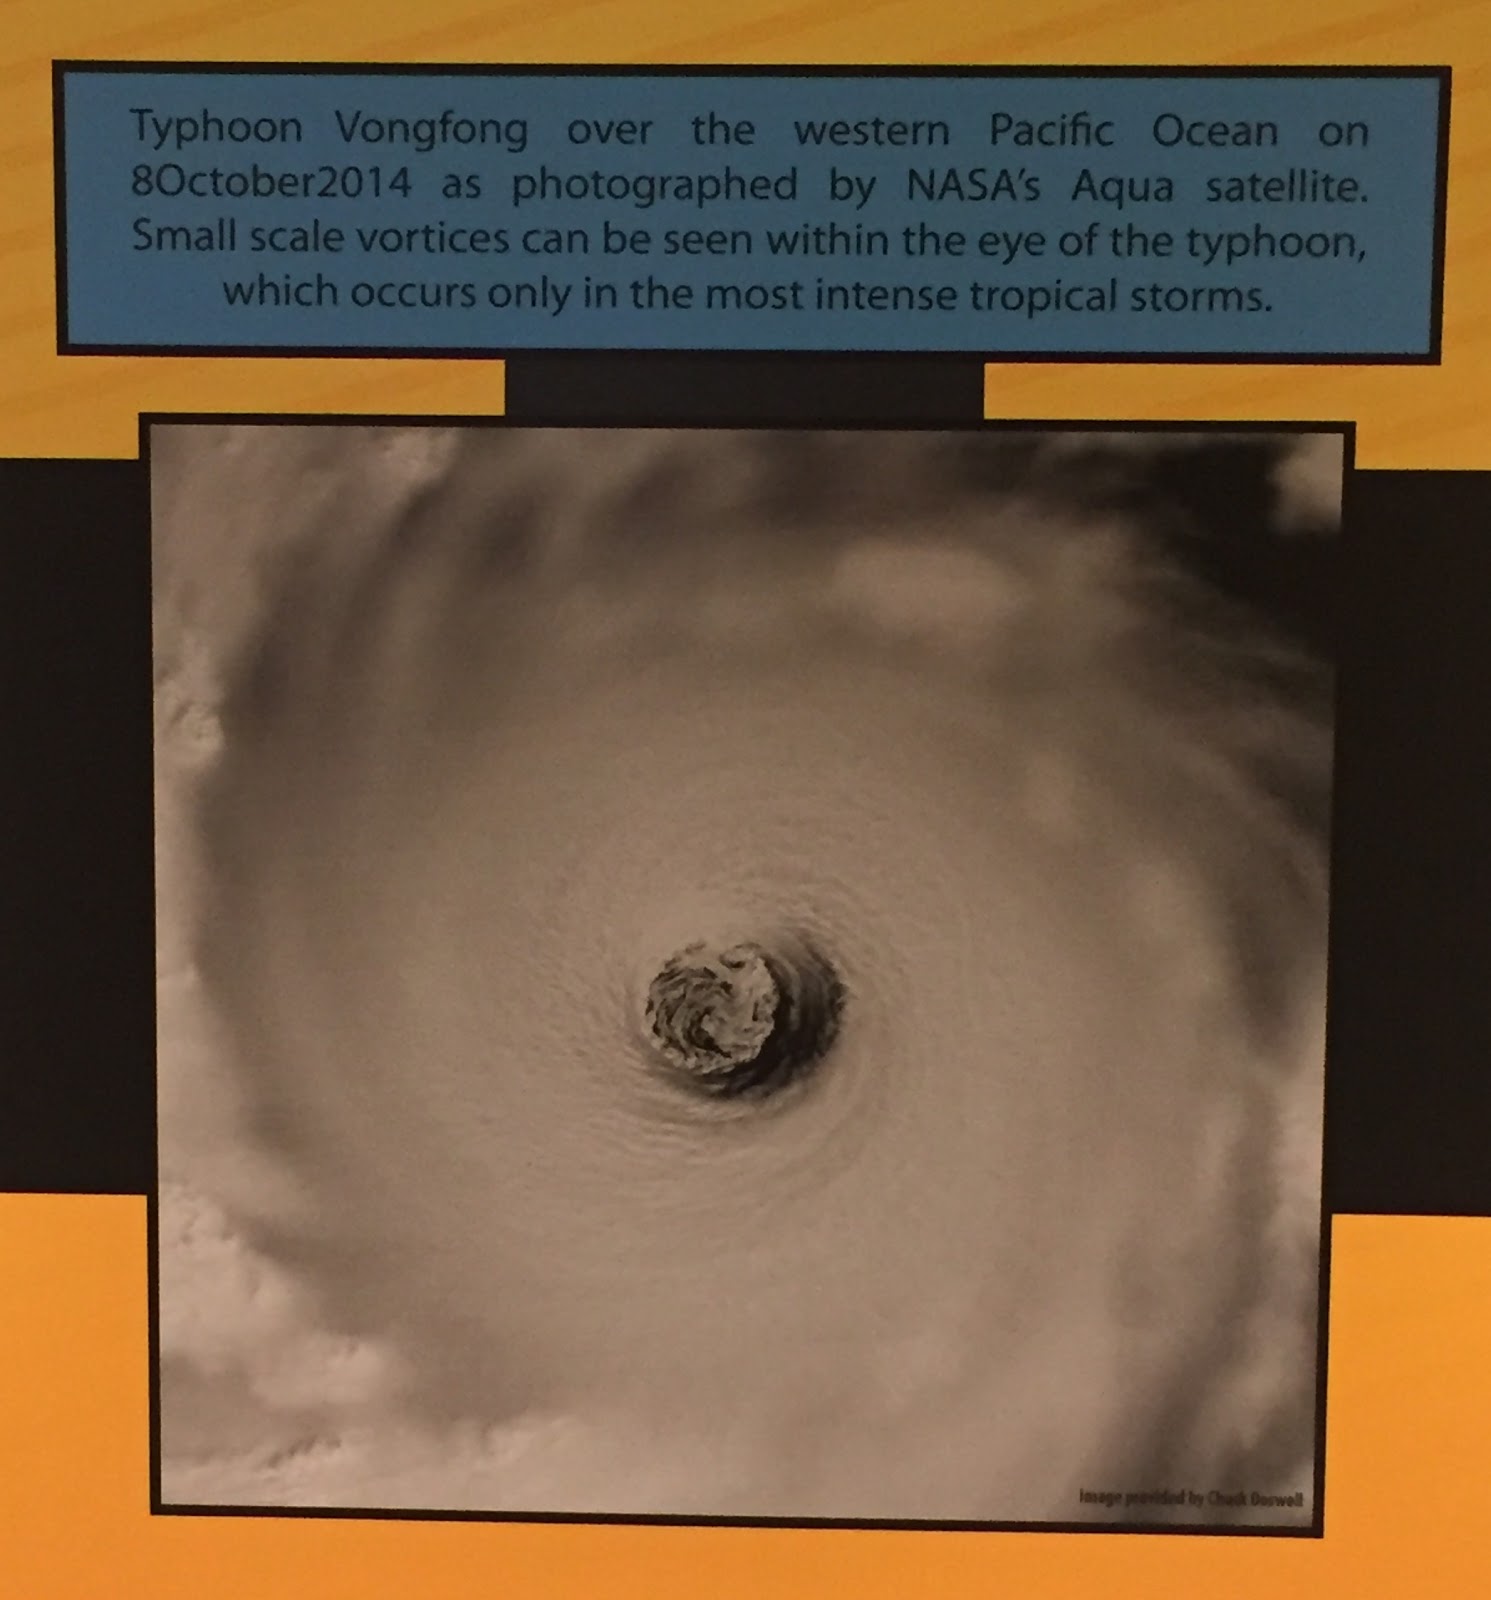
This photo depicts Typhoon Vongfong. This typhoon is displaying small scale vortices within the eye, a phenomena that only occurs in the strongest of tropical storms.
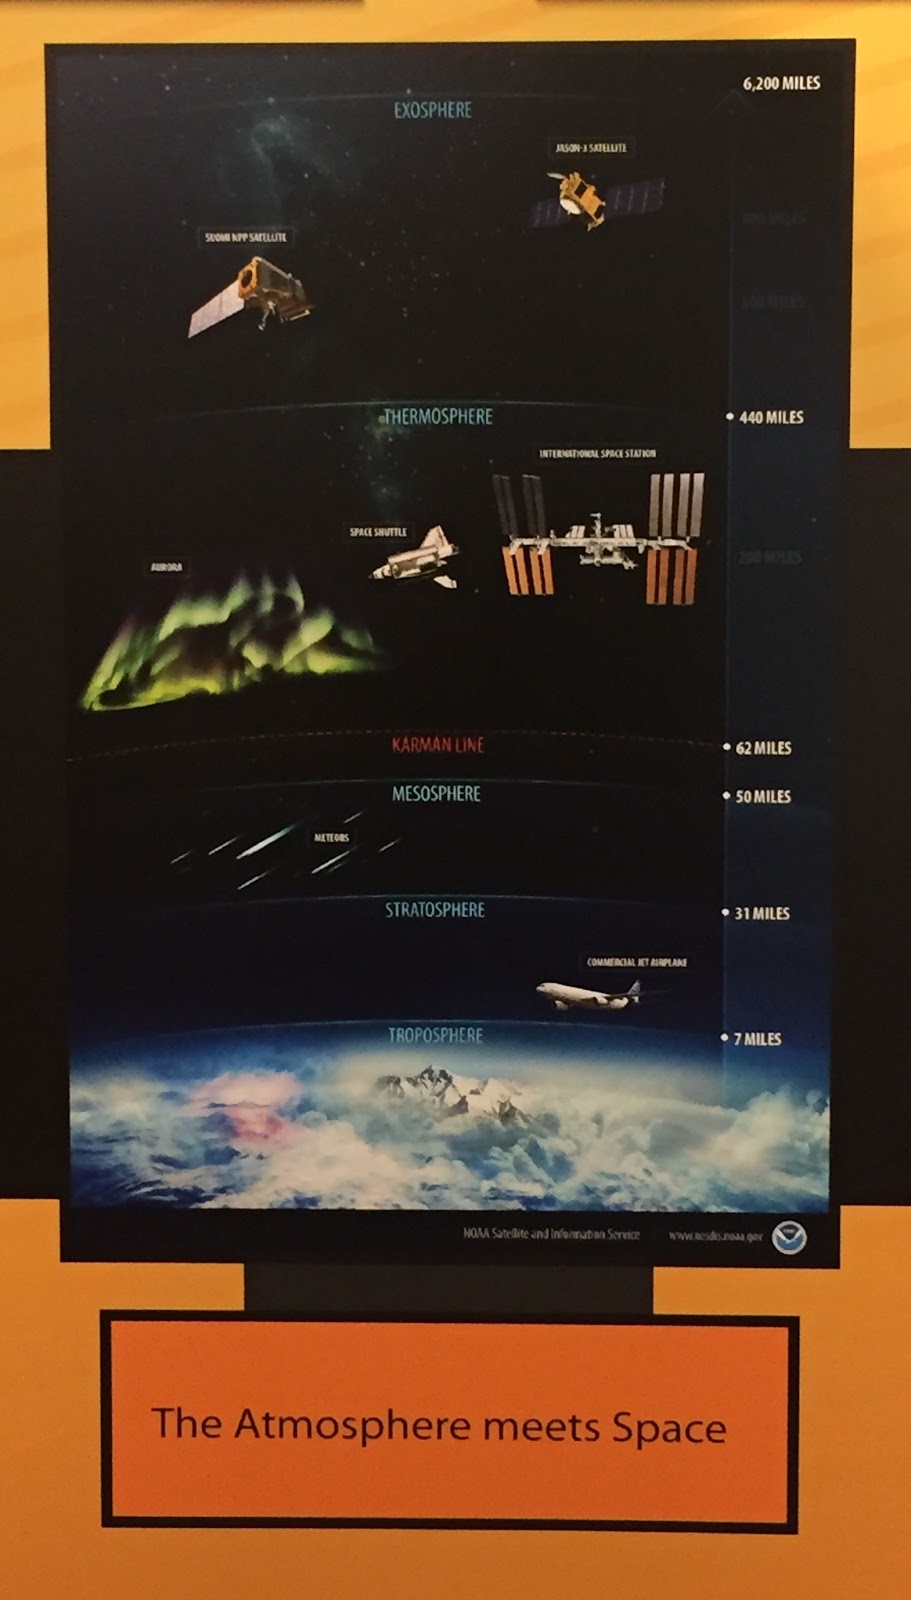
Starting from the layer closest to the ground, the structure of the atmosphere is as follows: troposphere (where weather occurs), stratosphere (where the maximum ozone heating is), mesosphere, thermosphere, and exosphere.
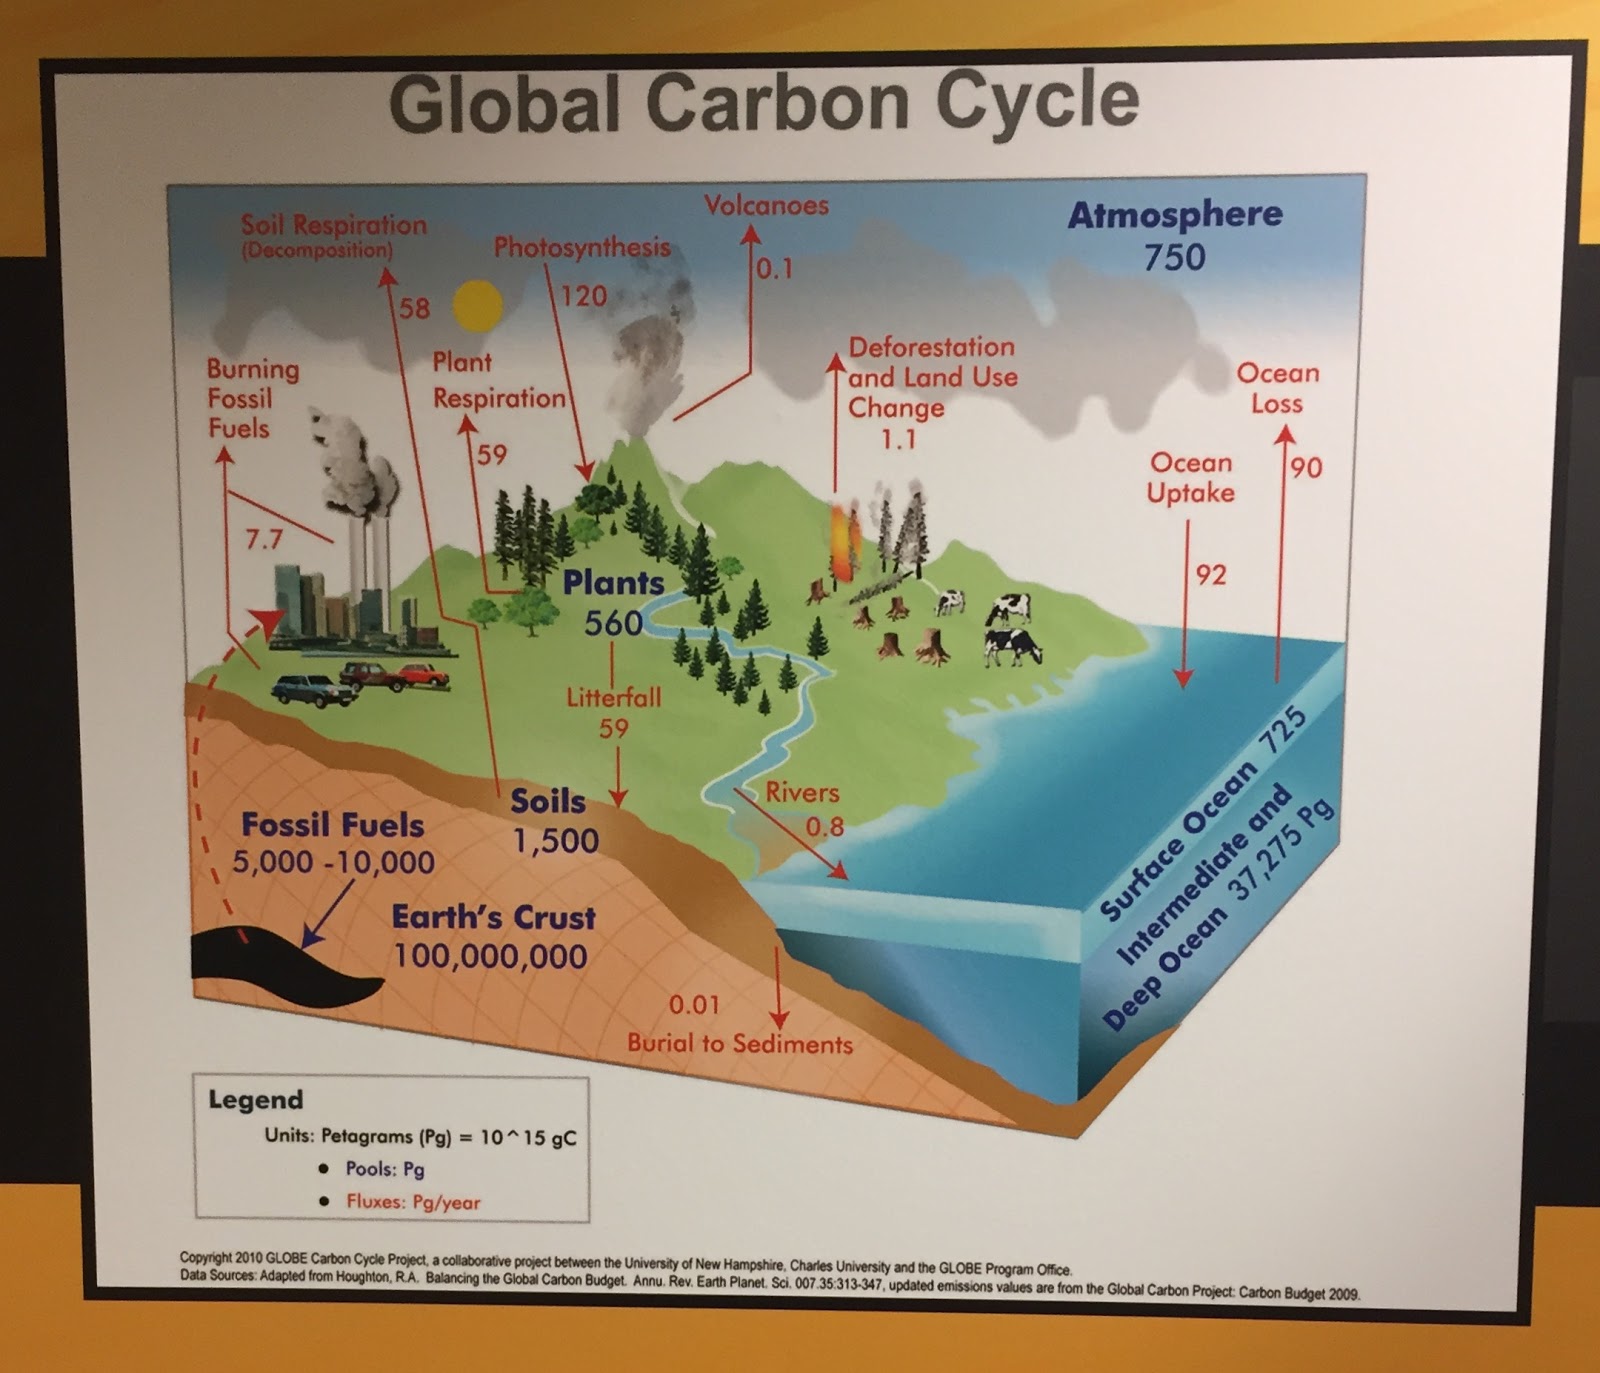
This photo depicts the global carbon cycle. For example, this shows how the ocean and photosynthesis can actually uptake carbon out of the atmosphere. On the flipside, however, volcanoes, soil and plant respiration, and the burning of fossil fuels can put more carbon back into the atmosphere.
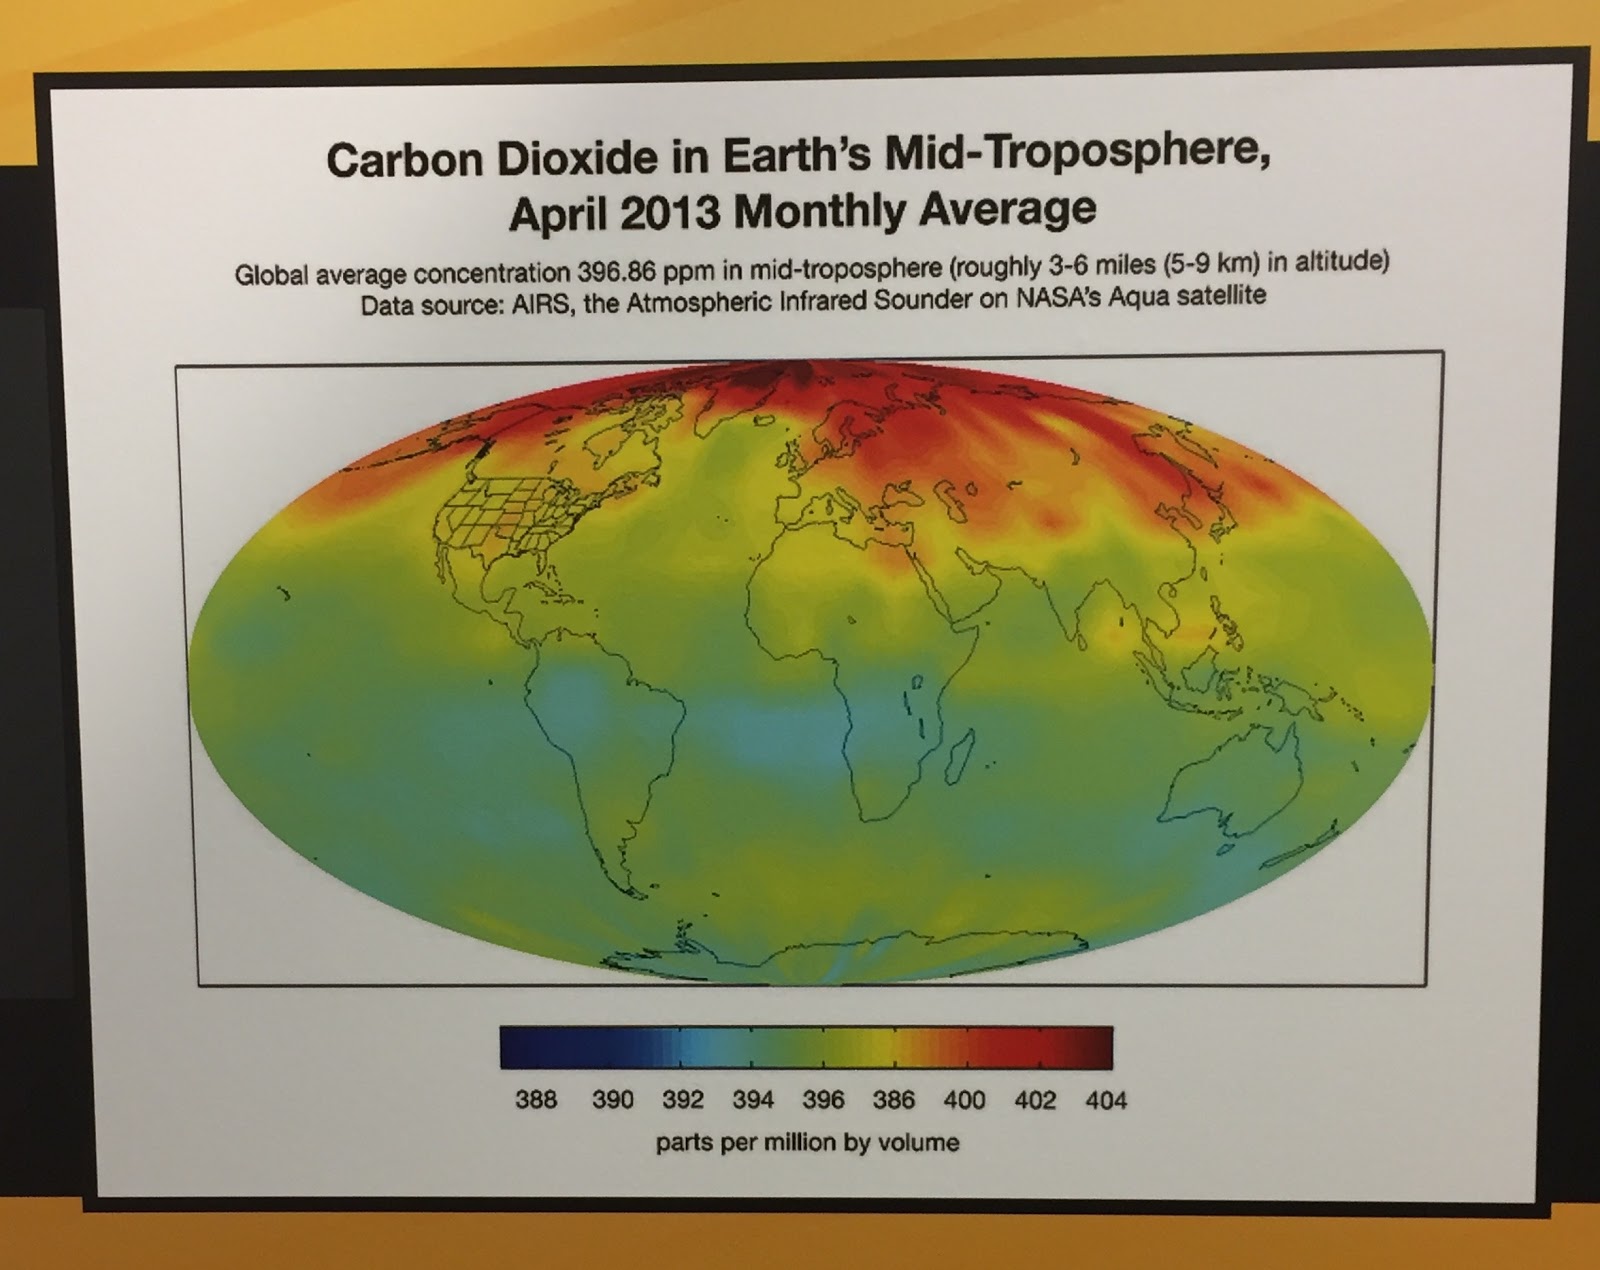
This photo depicts the amount of carbon dioxide in the atmosphere as of April 2013. At the time, the global average concentration was 396.86 parts per million in the mid-troposphere.
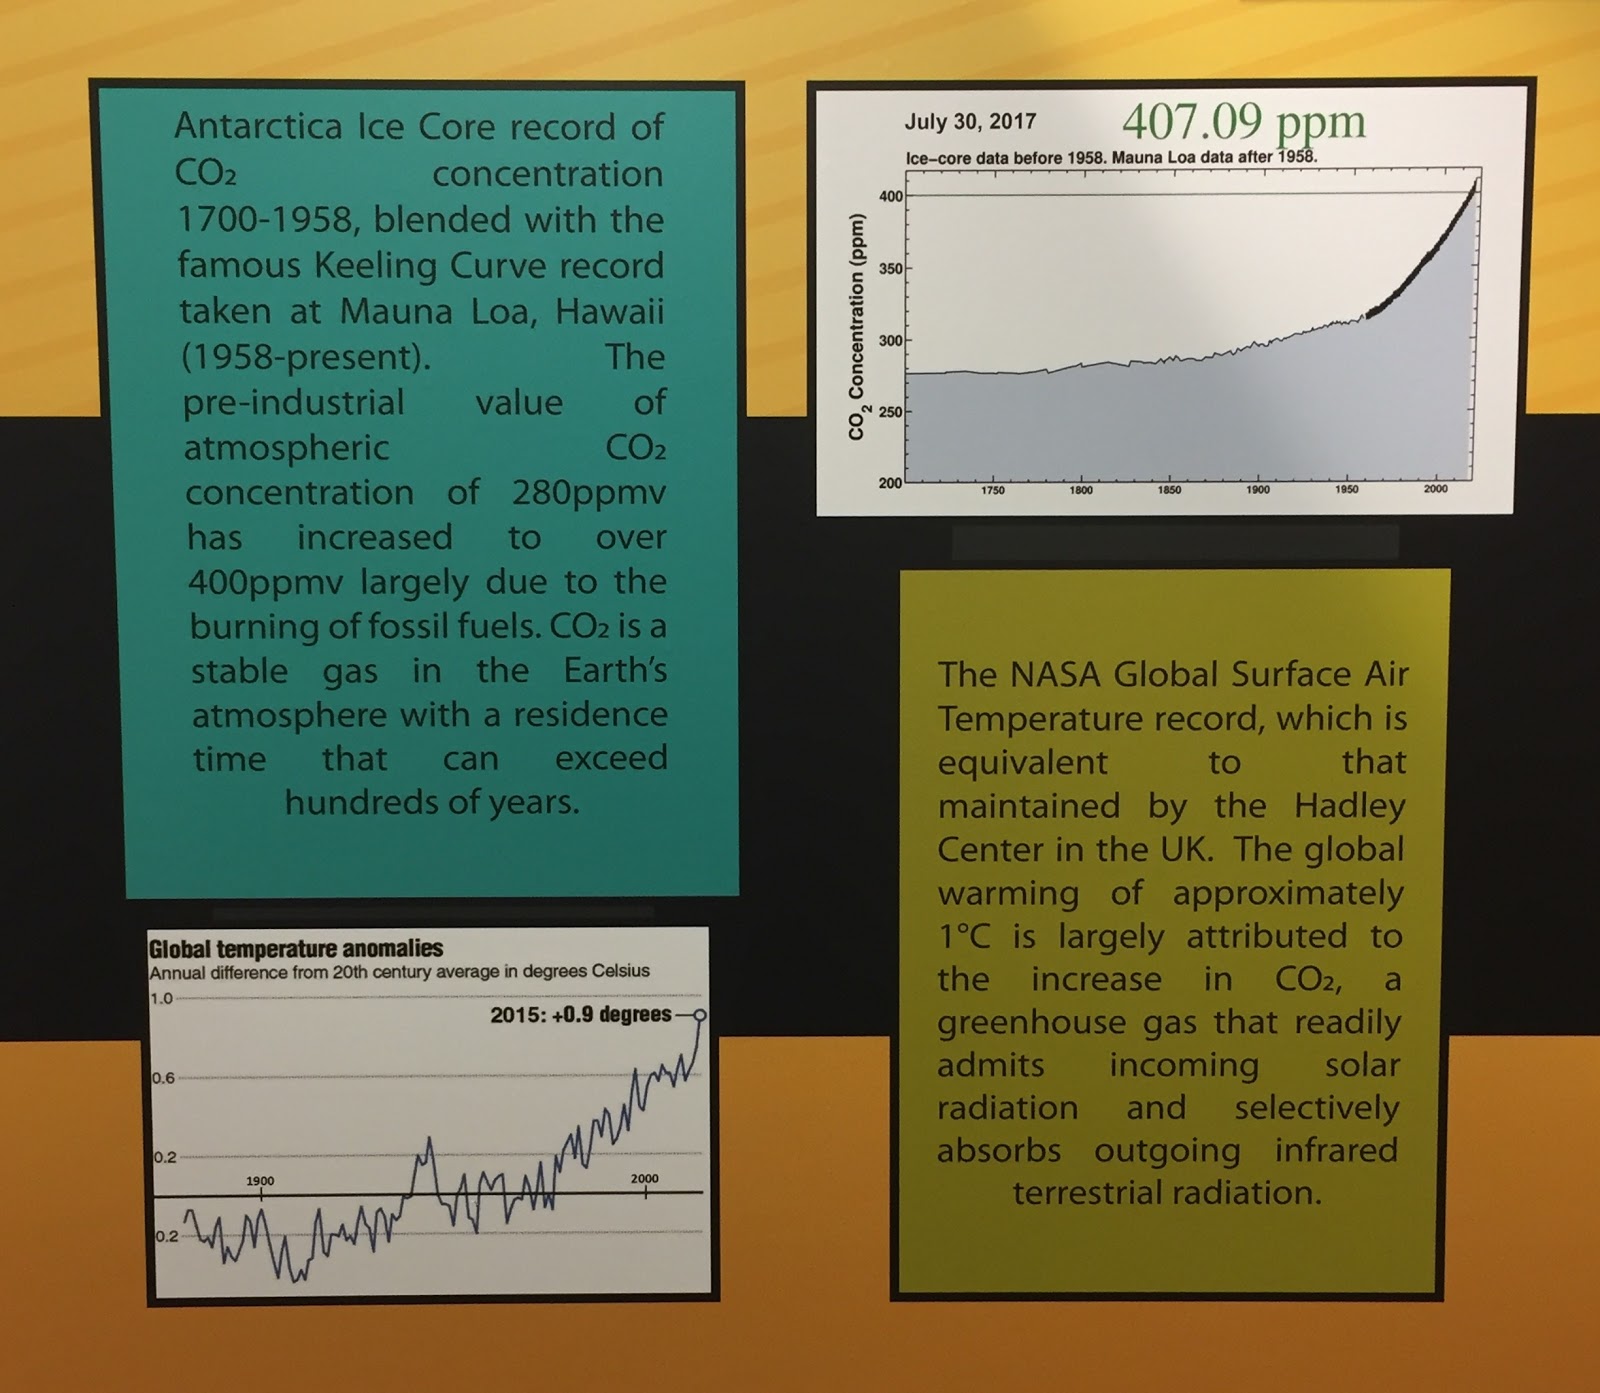
The graph on the right is the combination of the Mauna Loa data and ice-core data, showing a sharp increase in carbon dioxide levels (which, as of July 20, 2017, settled at 407.09 parts per million). The graph on the left is the annual temperature difference from the 20th century average in degrees Celsius. This increase in carbon dioxide is widely attributed to the burning of fossil fuels.
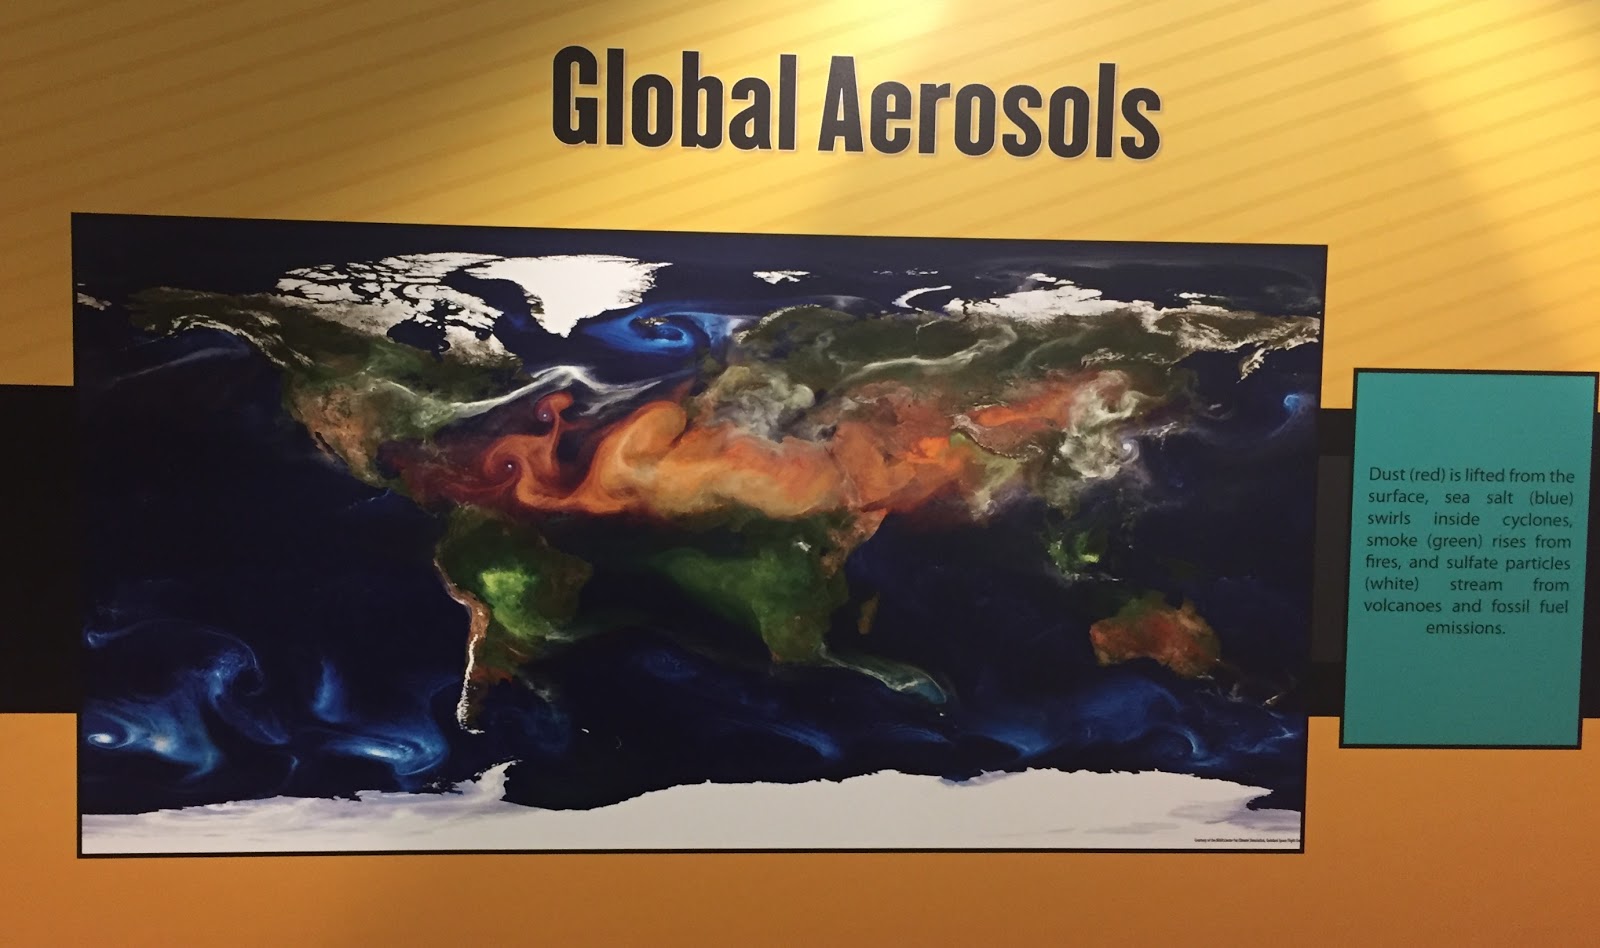
This is a photo depicting the global aerosols- white depicts fossil fuel emissions and stream from volcanoes, blue means sea salt, green represents sulfate particles and smoke from fires, and red symbolizes dust.
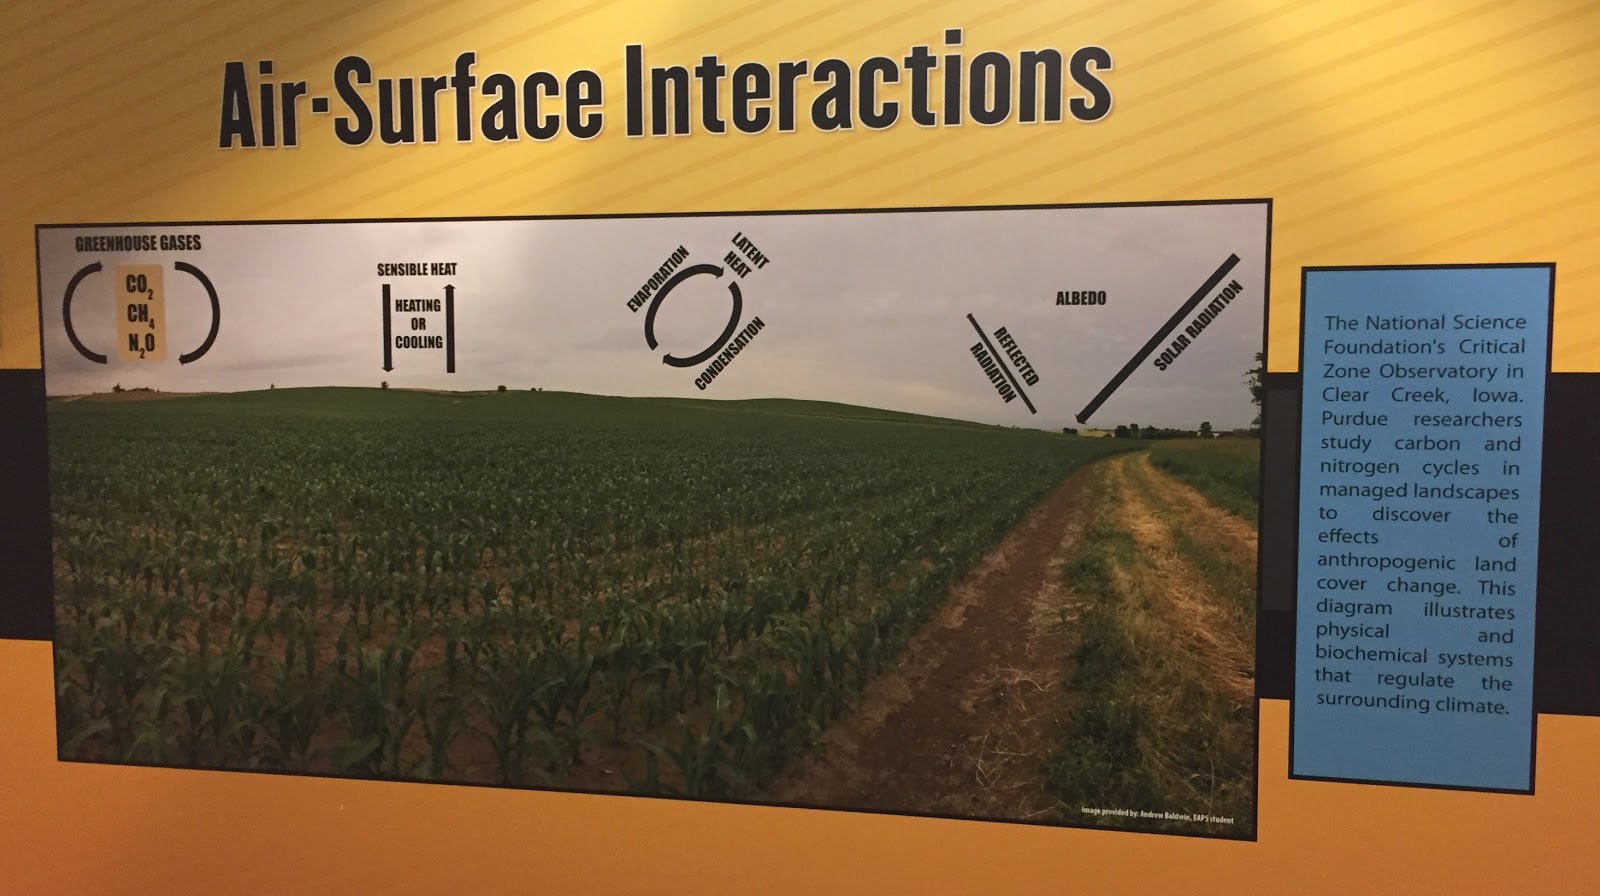
This photo depicts physical and biochemical systems that regulate the surrounding climate, such as solar radiation, evaporation/condensation, sensible heat, and greenhouse gases.
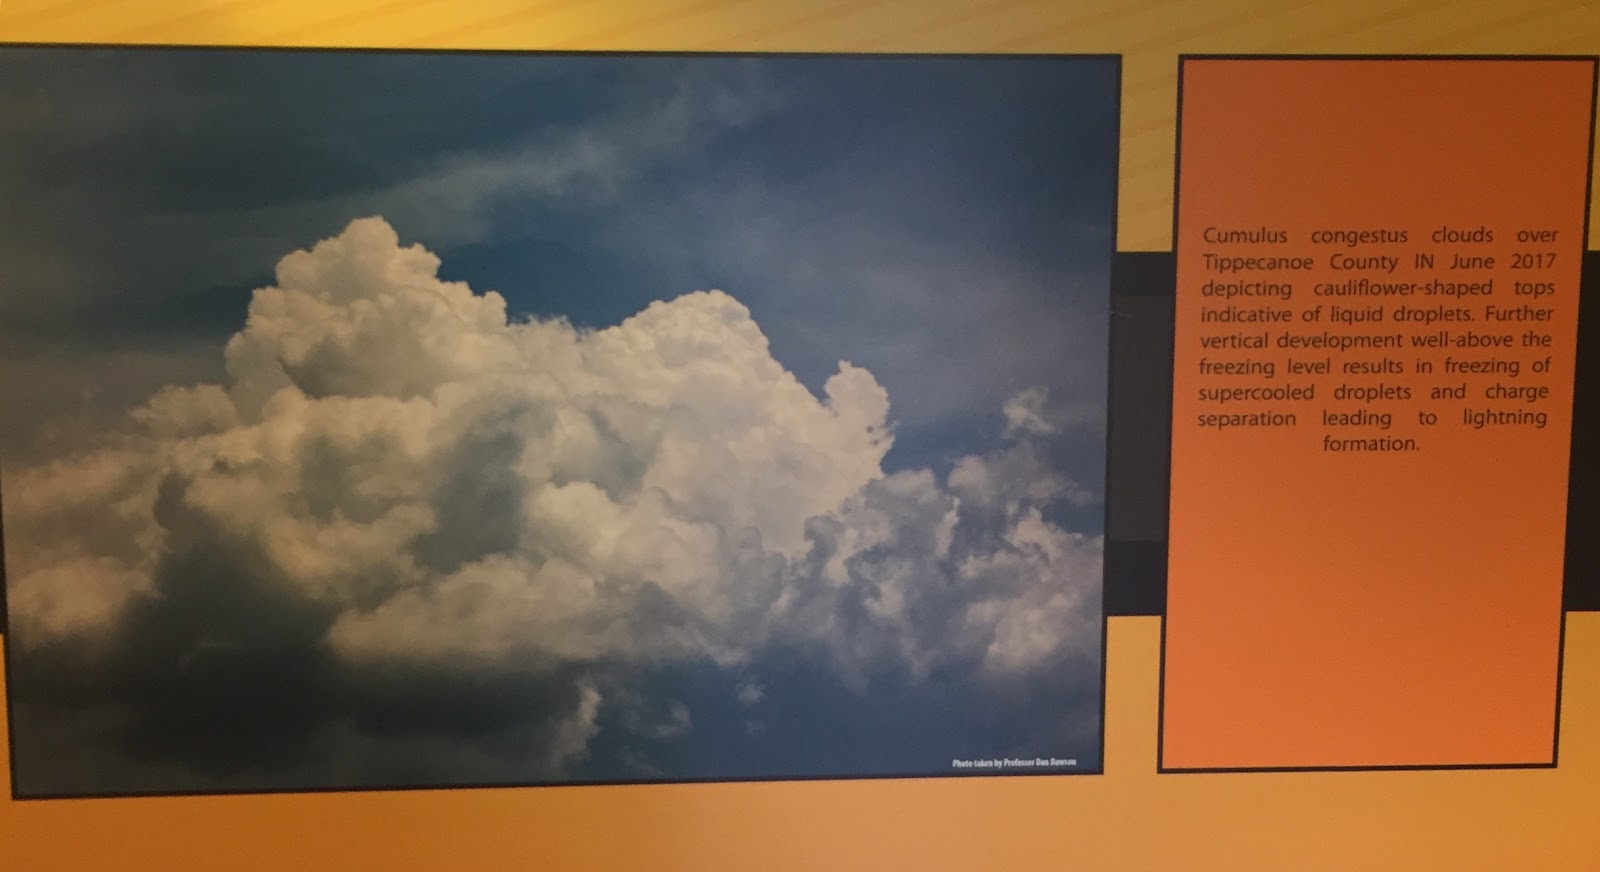
This is a cumulus congestus cloud, showing its characteristic cauliflower-shaped top. That shape means that there are liquid droplets. Should the cloud grow above the freezing lever, supercooled droplets will freeze, leading to charge separation and, consequently, lightning formation.
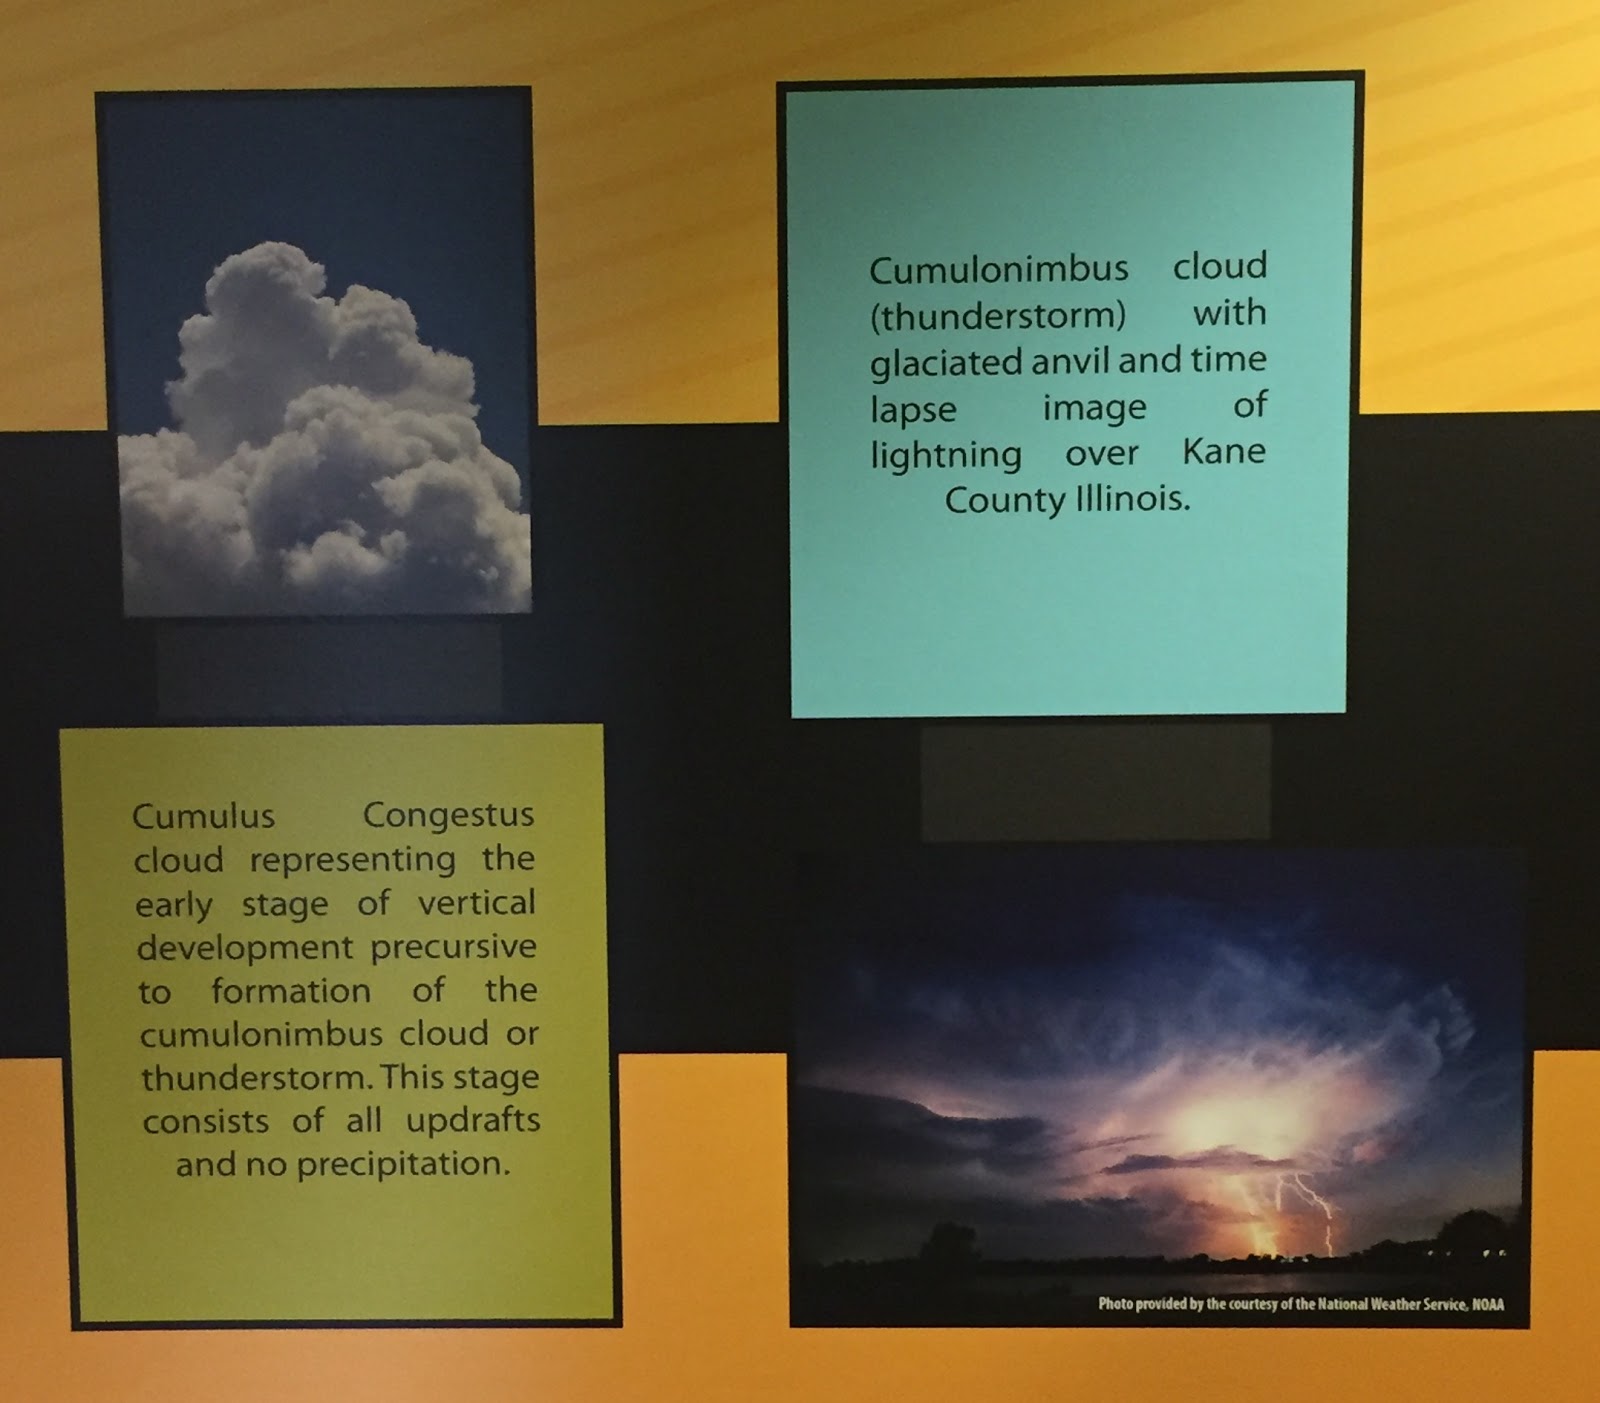
In the cumulus congestus stage, there is only an updraft and no precipitation. During the mature stage (as shown in the thunderstorm in the bottom corner), there is both an updraft and a downdraft with precipitation.
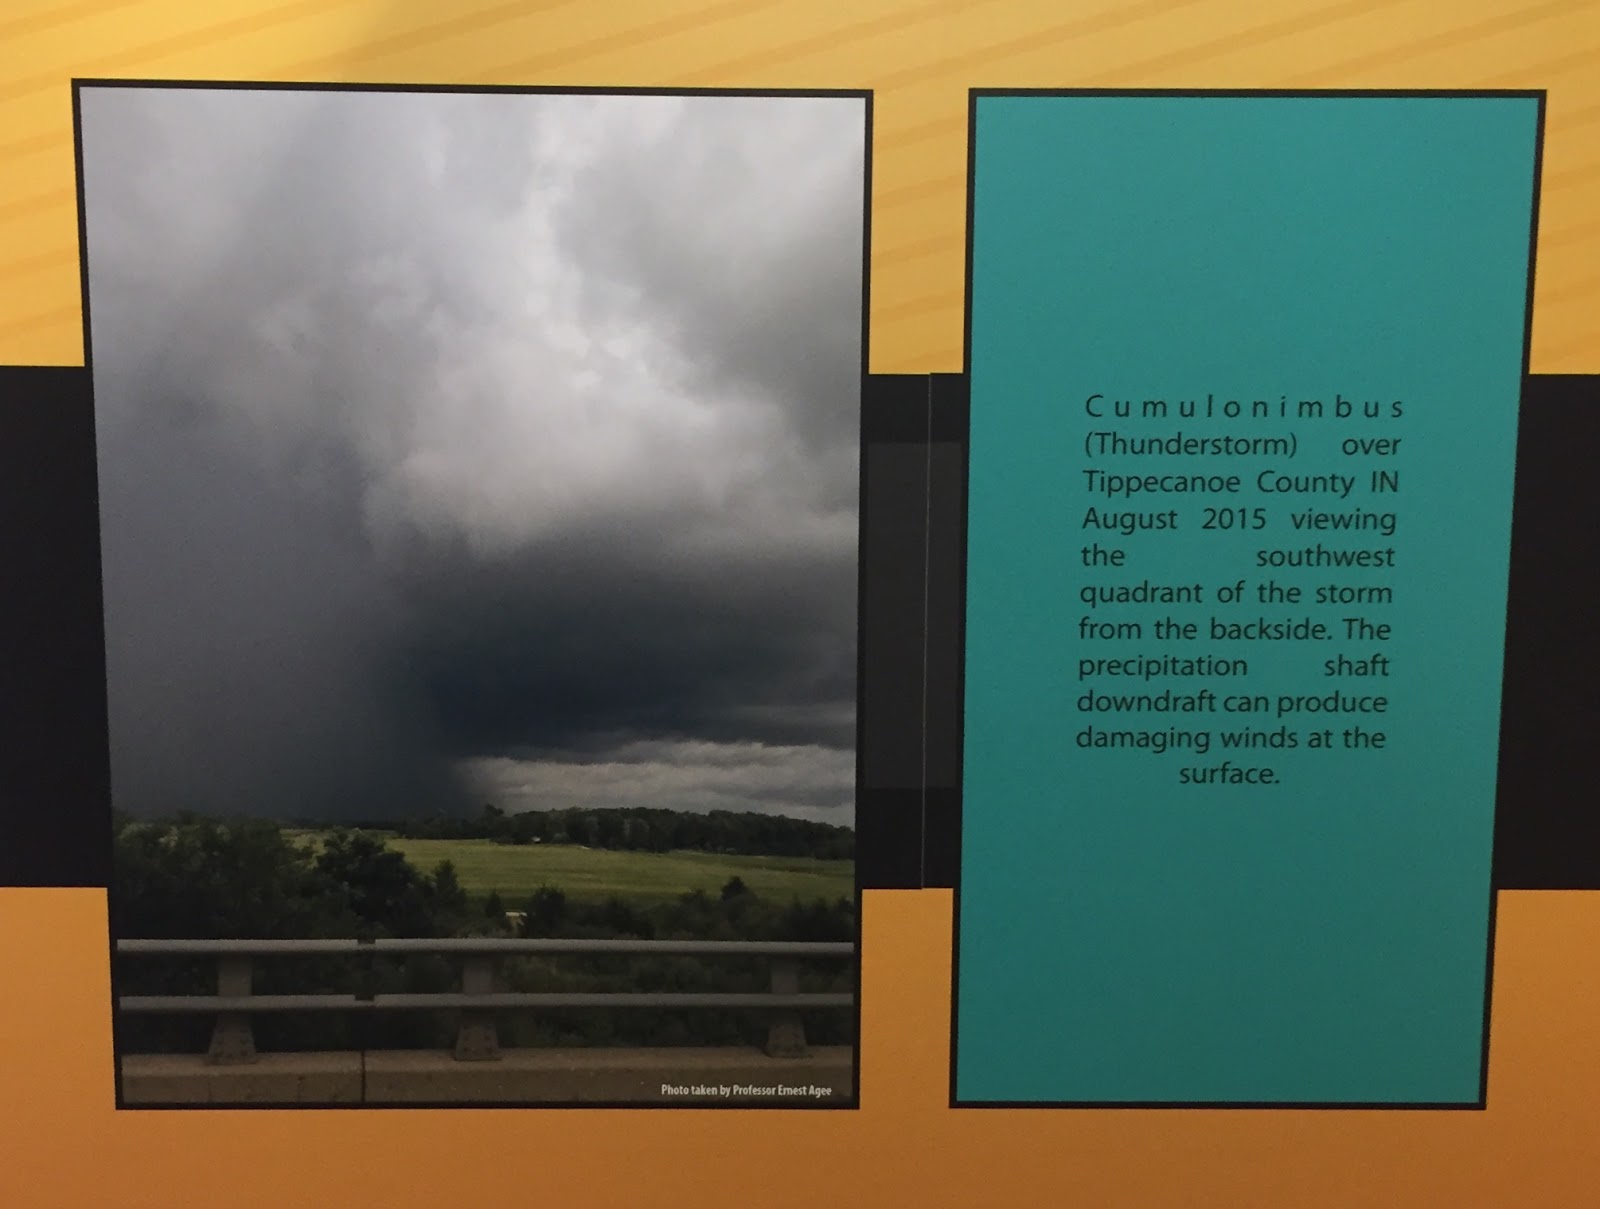
This is a photo of a cumulonimbus cloud over Tippecanoe County, Indiana, showing the southwest quadrant of the storm. Damaging winds can be produced from the precipitation shaft downdraft.
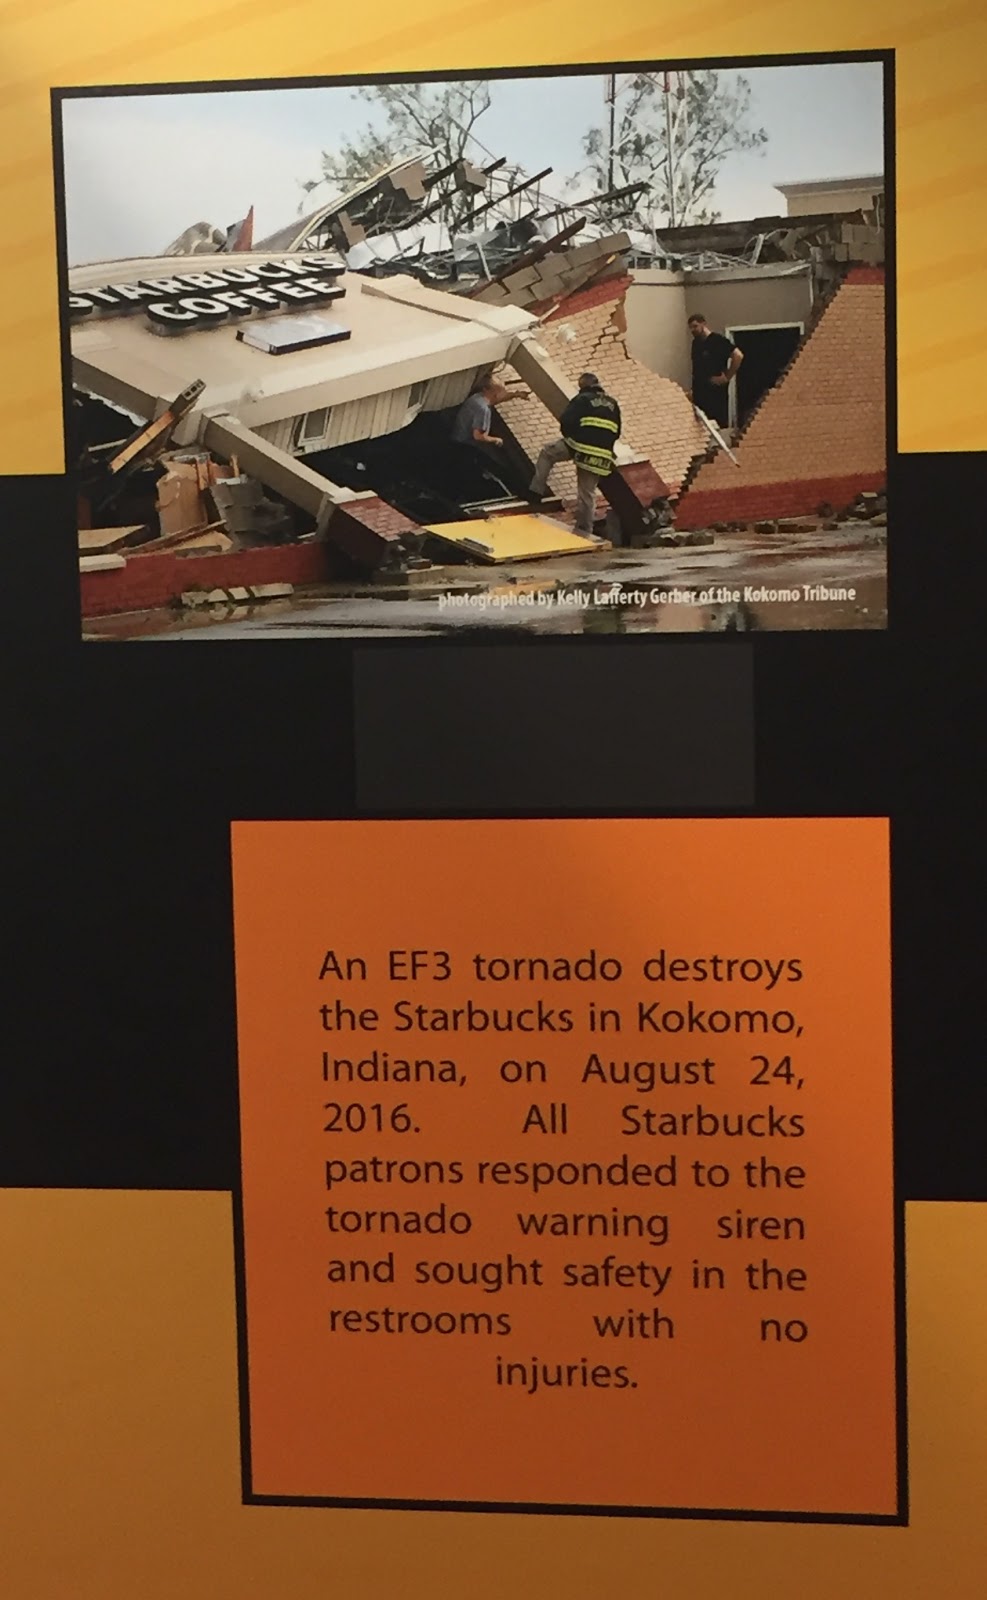
This shows the potential power of a tornado- an EF3 tornado struck a Starbucks in Kokomo, Indiana in 2016. However, since all of the people within the establishment followed tornado-safety instructions, there were no injuries!
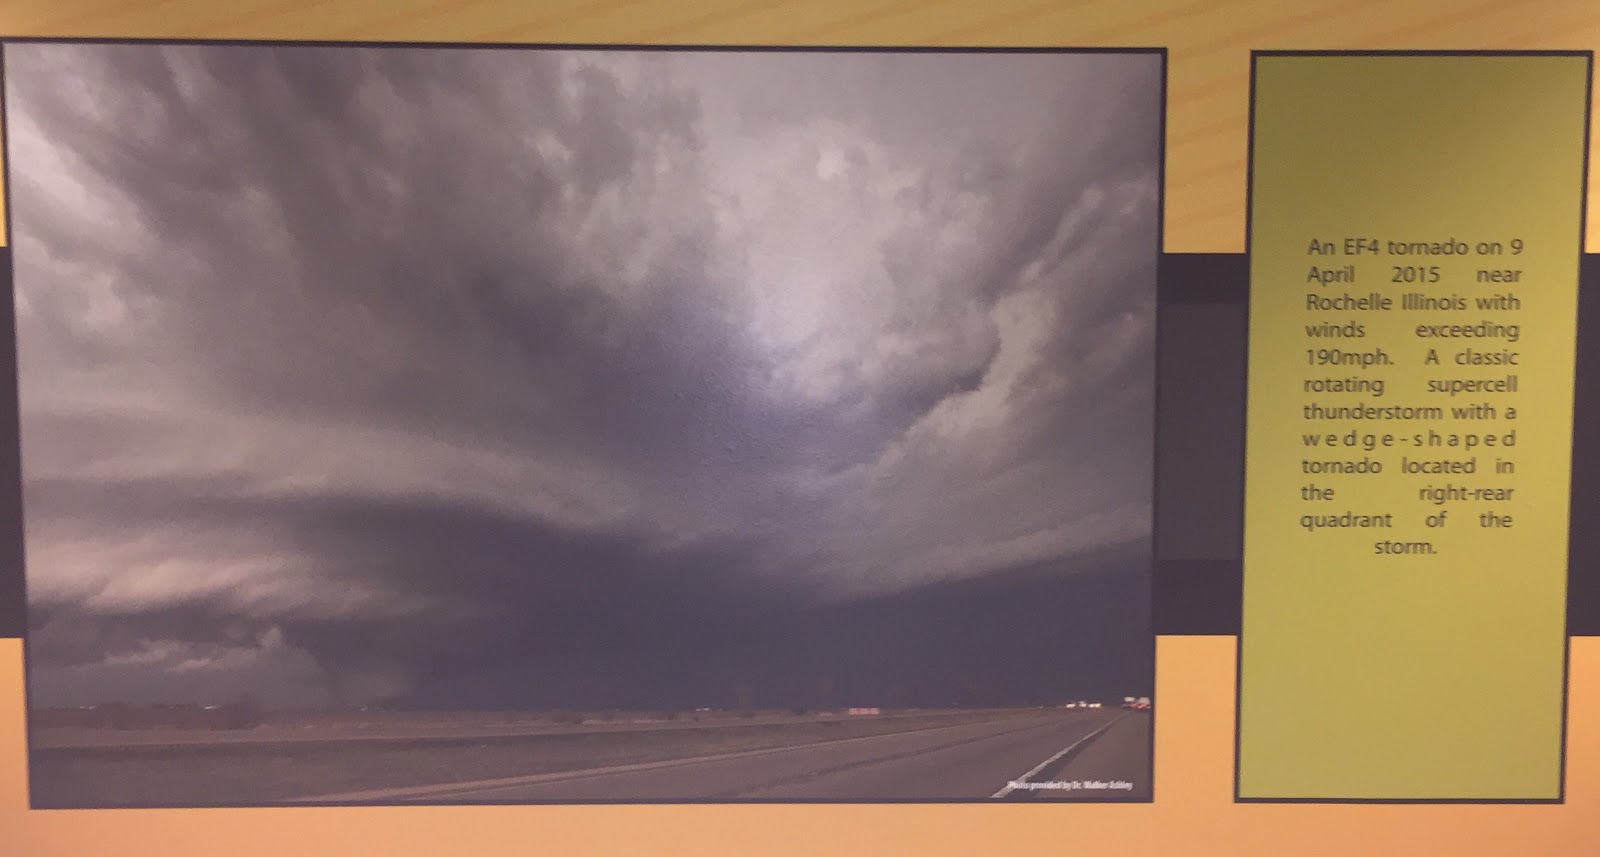
Ten miles per hour short of an EF5, this EF4 wedge-tornado passed by Rochelle Illinois in April of 2019. As per usual with supercell thunderstorms, this tornado was located in the right-rear quadrant.
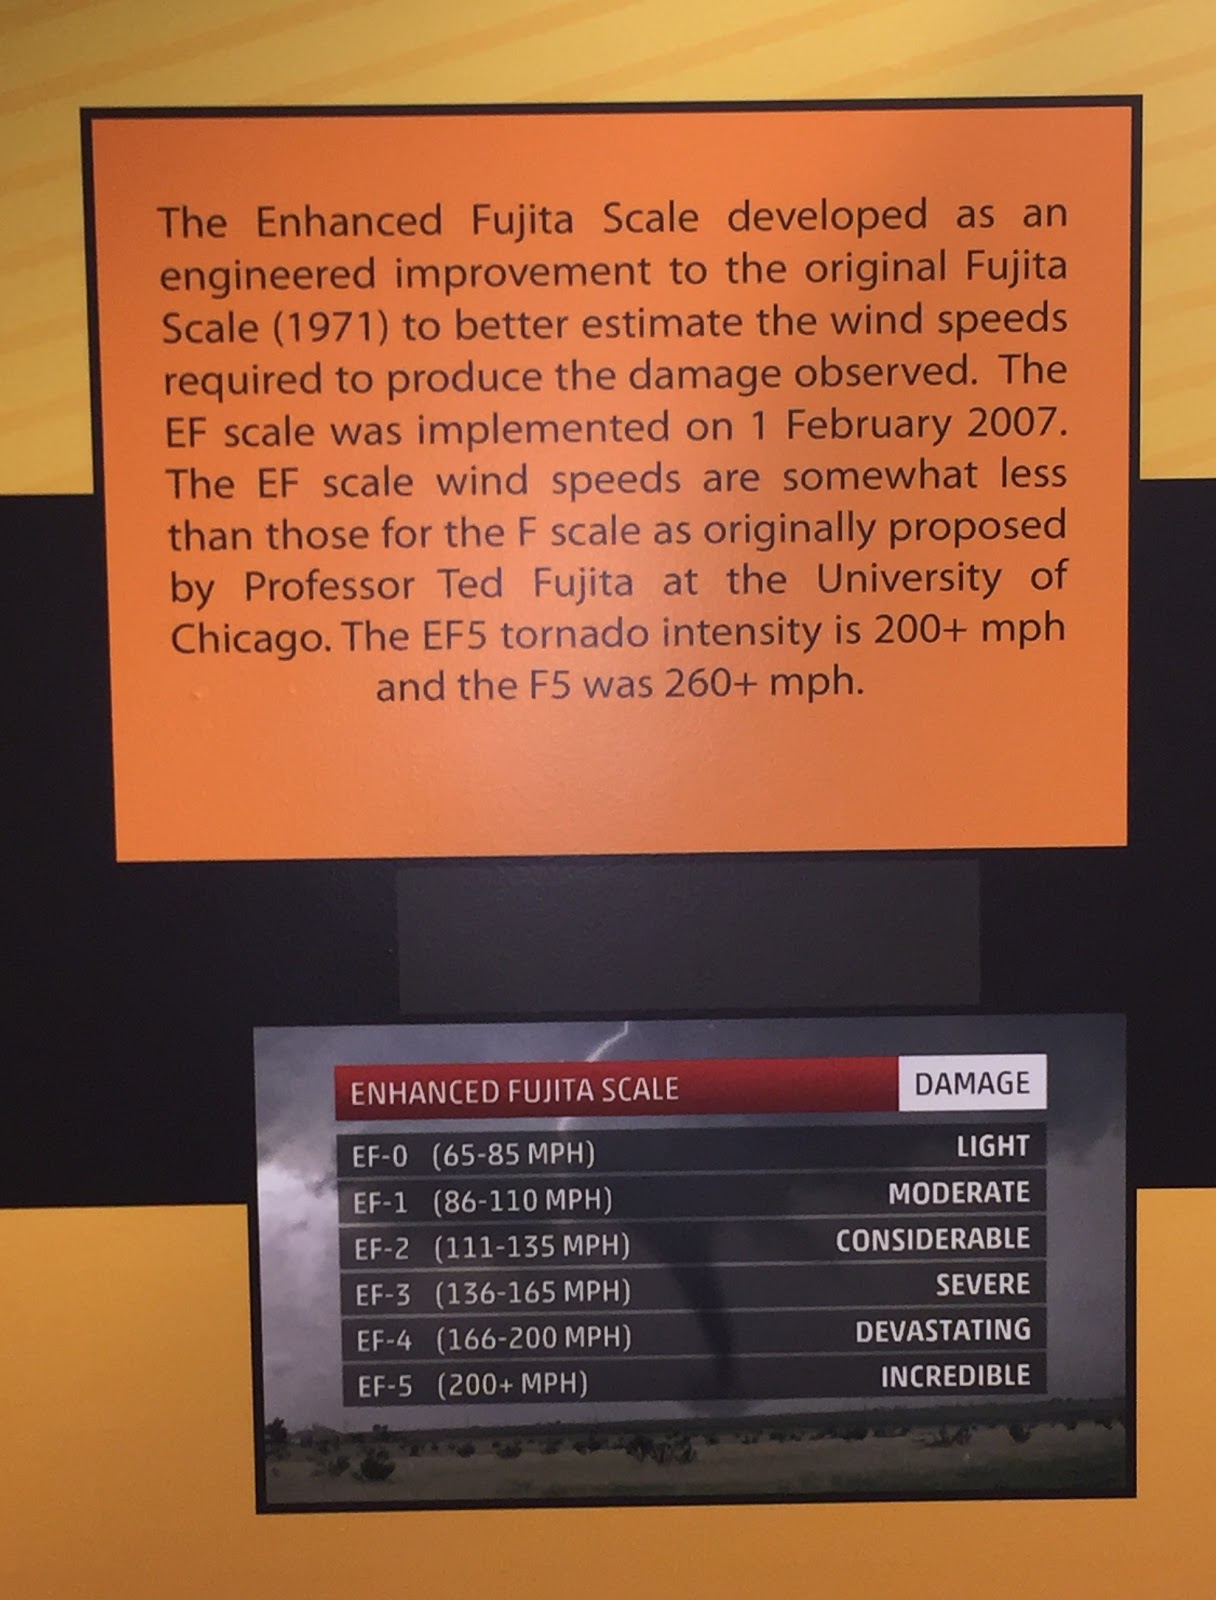
Prior to 2007, the scale that estimated the strength of a tornado was the Fujita Scale, which was implemented in 1971. As of February 1, 2007, however, the scale was modified into the Enhanced Fujita Scale, lowering the wind speeds, required for the various levels. For example, an F5 tornado strength was given when there was over two-hundred sixty miles per hour wind speeds, but an EF5 tornado is simply any wind speed over two-hundred.
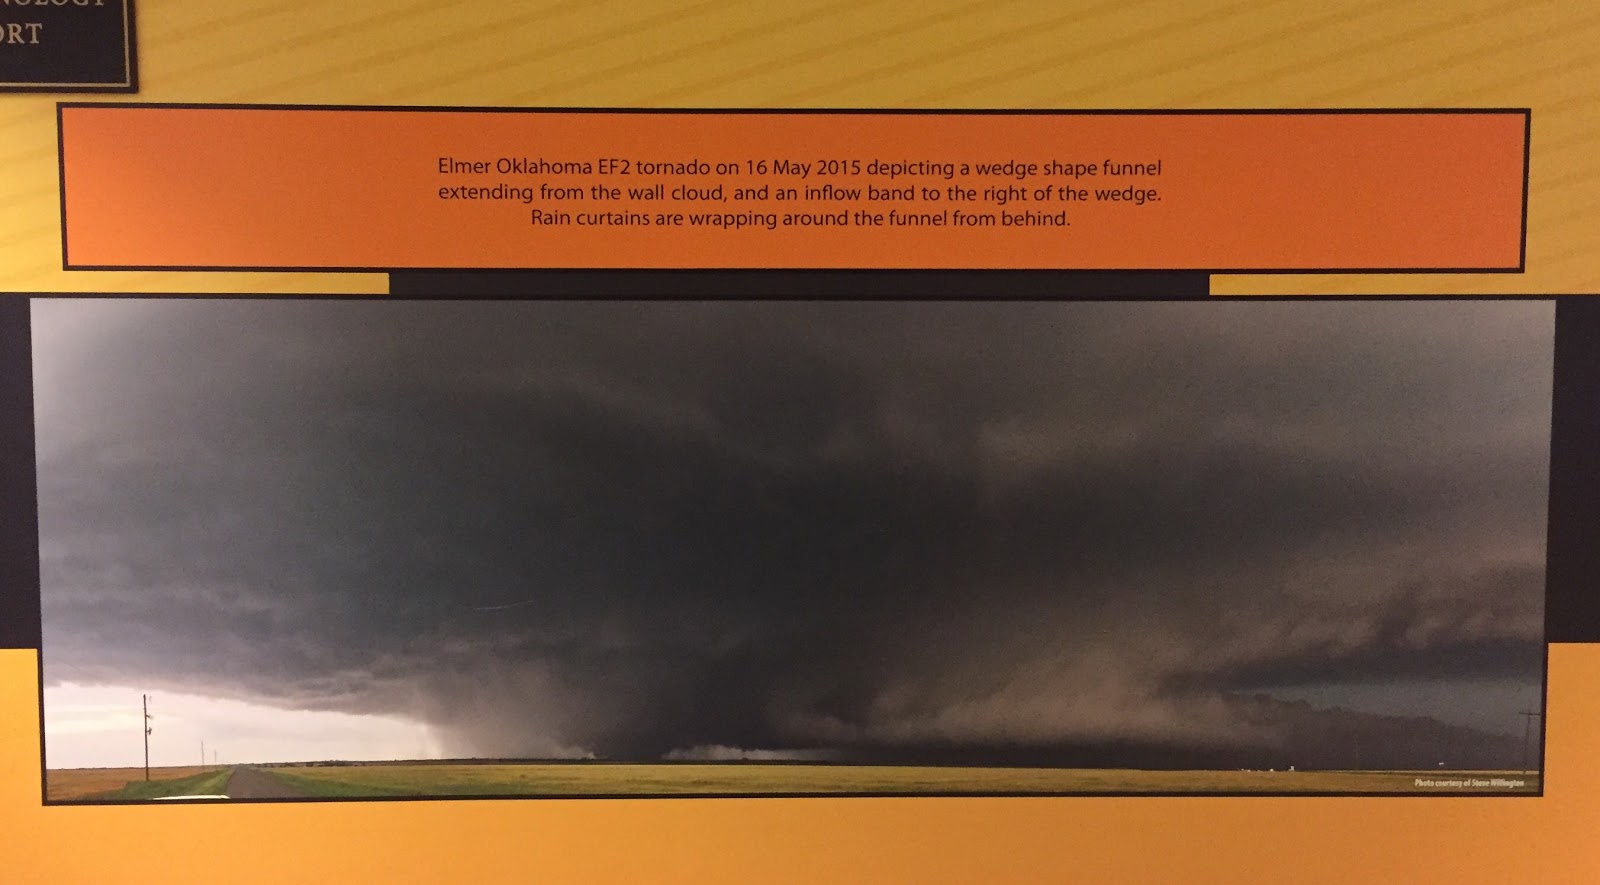
This is a photo of a wedge tornado- it is a rain-wrapped tornado as shown by the curtain of precipitation circling around the funnel from behind. This storm also has an inflow band, depicted to the right of the tornado. This tornado was given a strength of EF2 (Enhanced Fujita Scale, level 2).
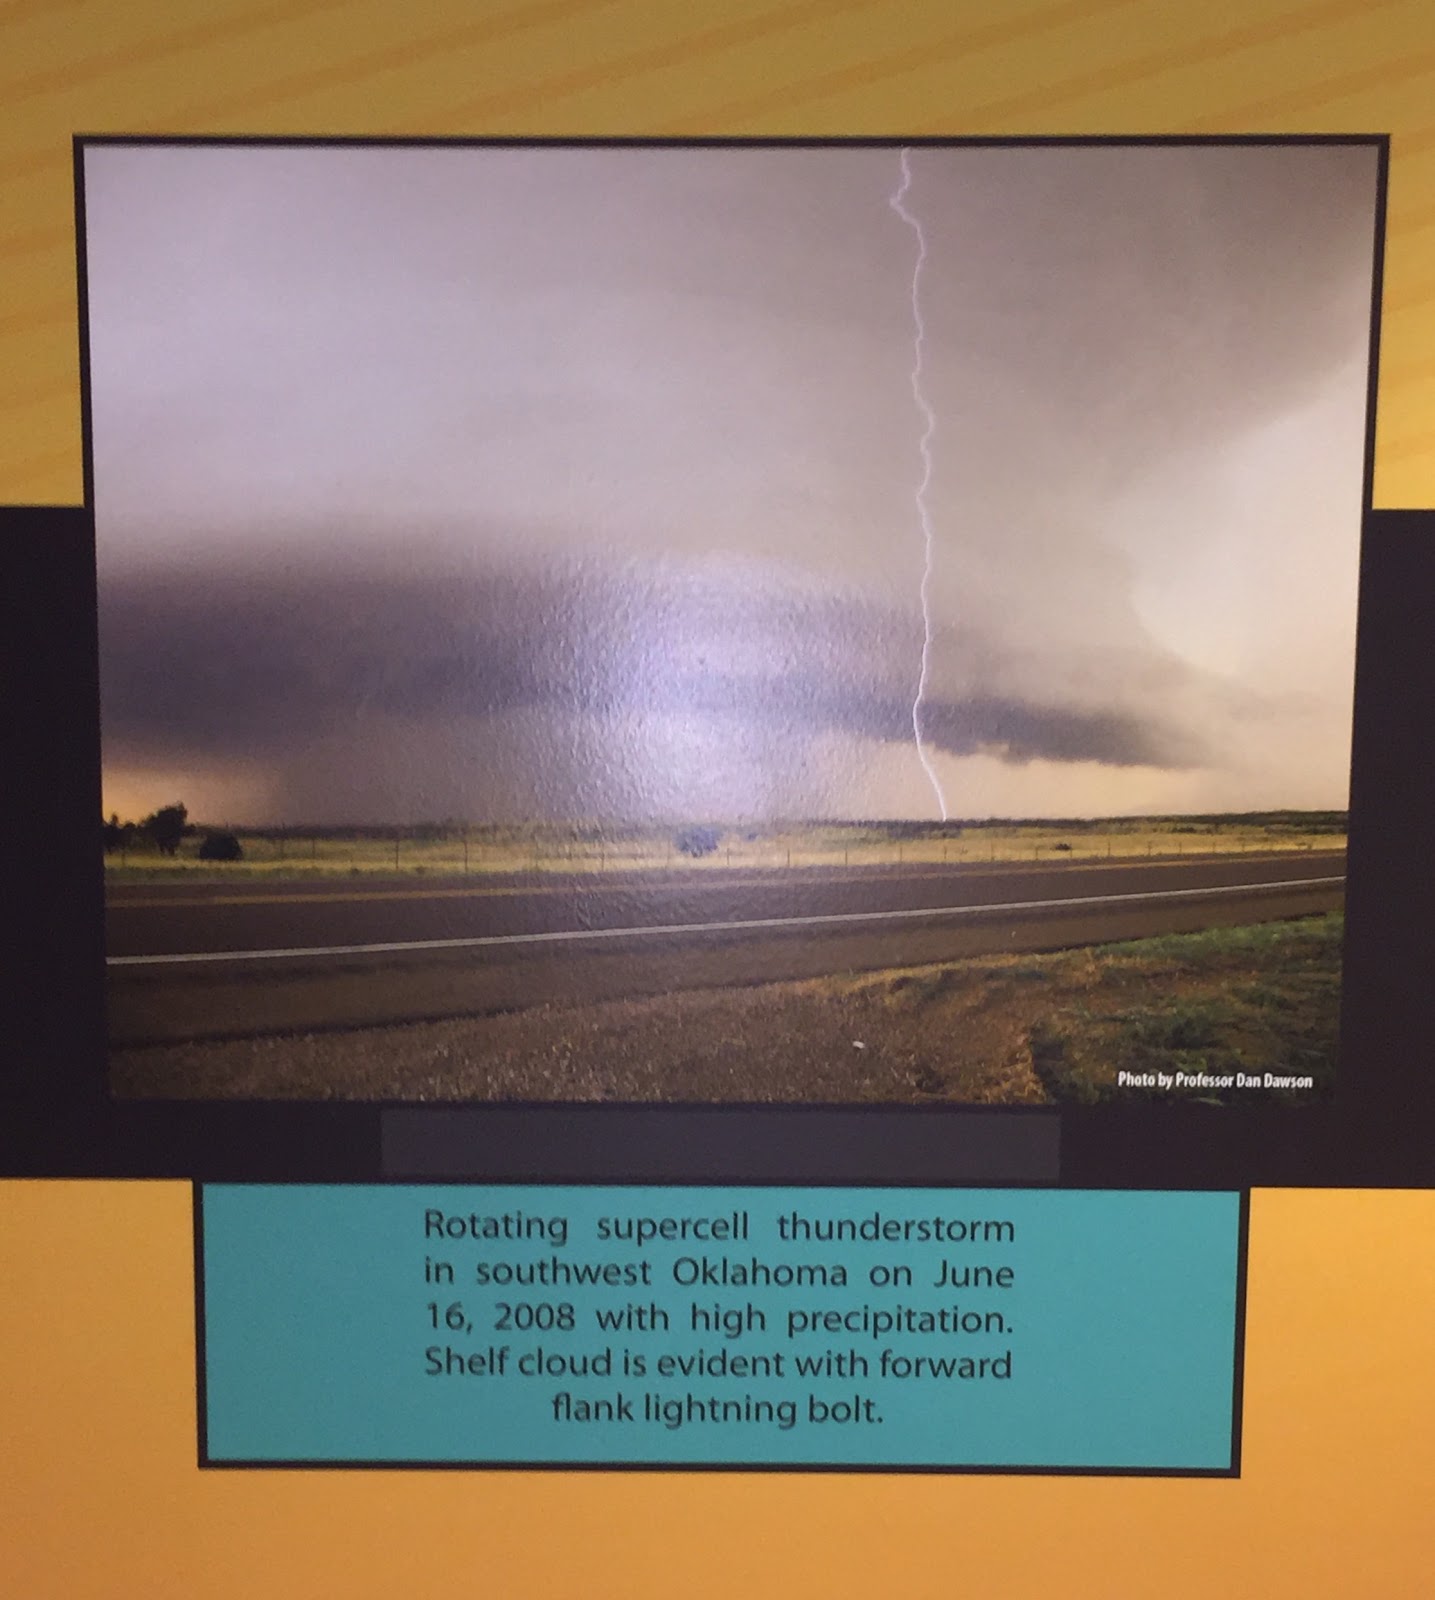
This is a photo of a high-precipitation, rotating supercell.
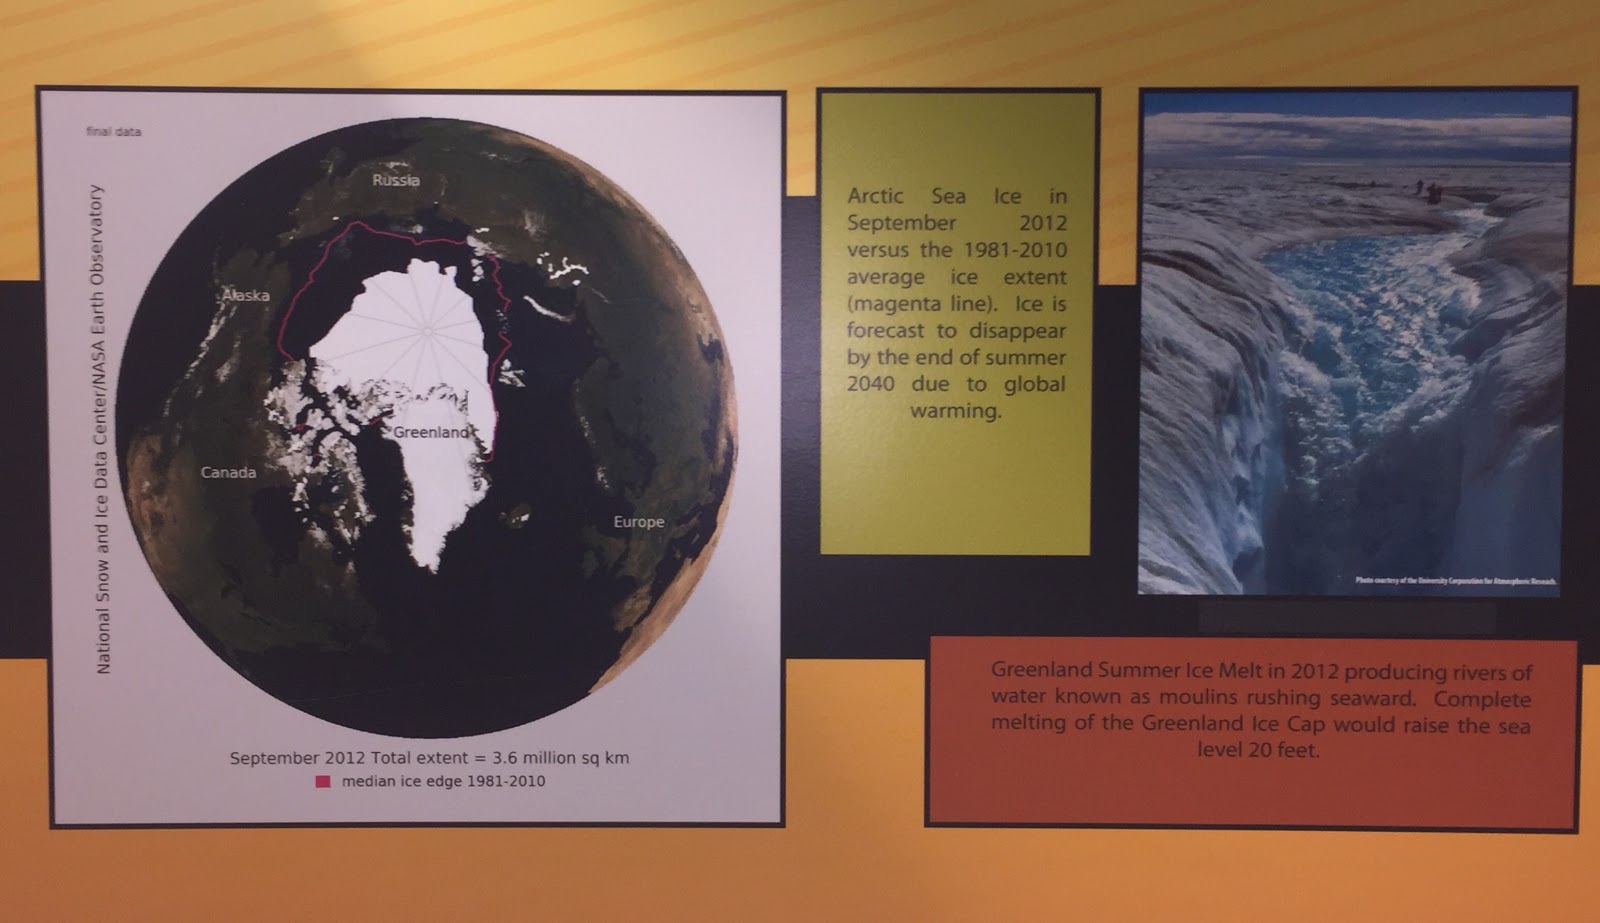
Due to global warming ice has already been melting. In fact, ice is predicted to be entirely gone by the year 2040. However, the Earth is already seeing the effects of melting ice- the photo on the left depicts how much Arctic Sea Ice there was in 1981-2010 (magenta line) versus the average in 2012 (what remains). Furthermore, ice melts produce moulins (rivers of water rushing seaward).
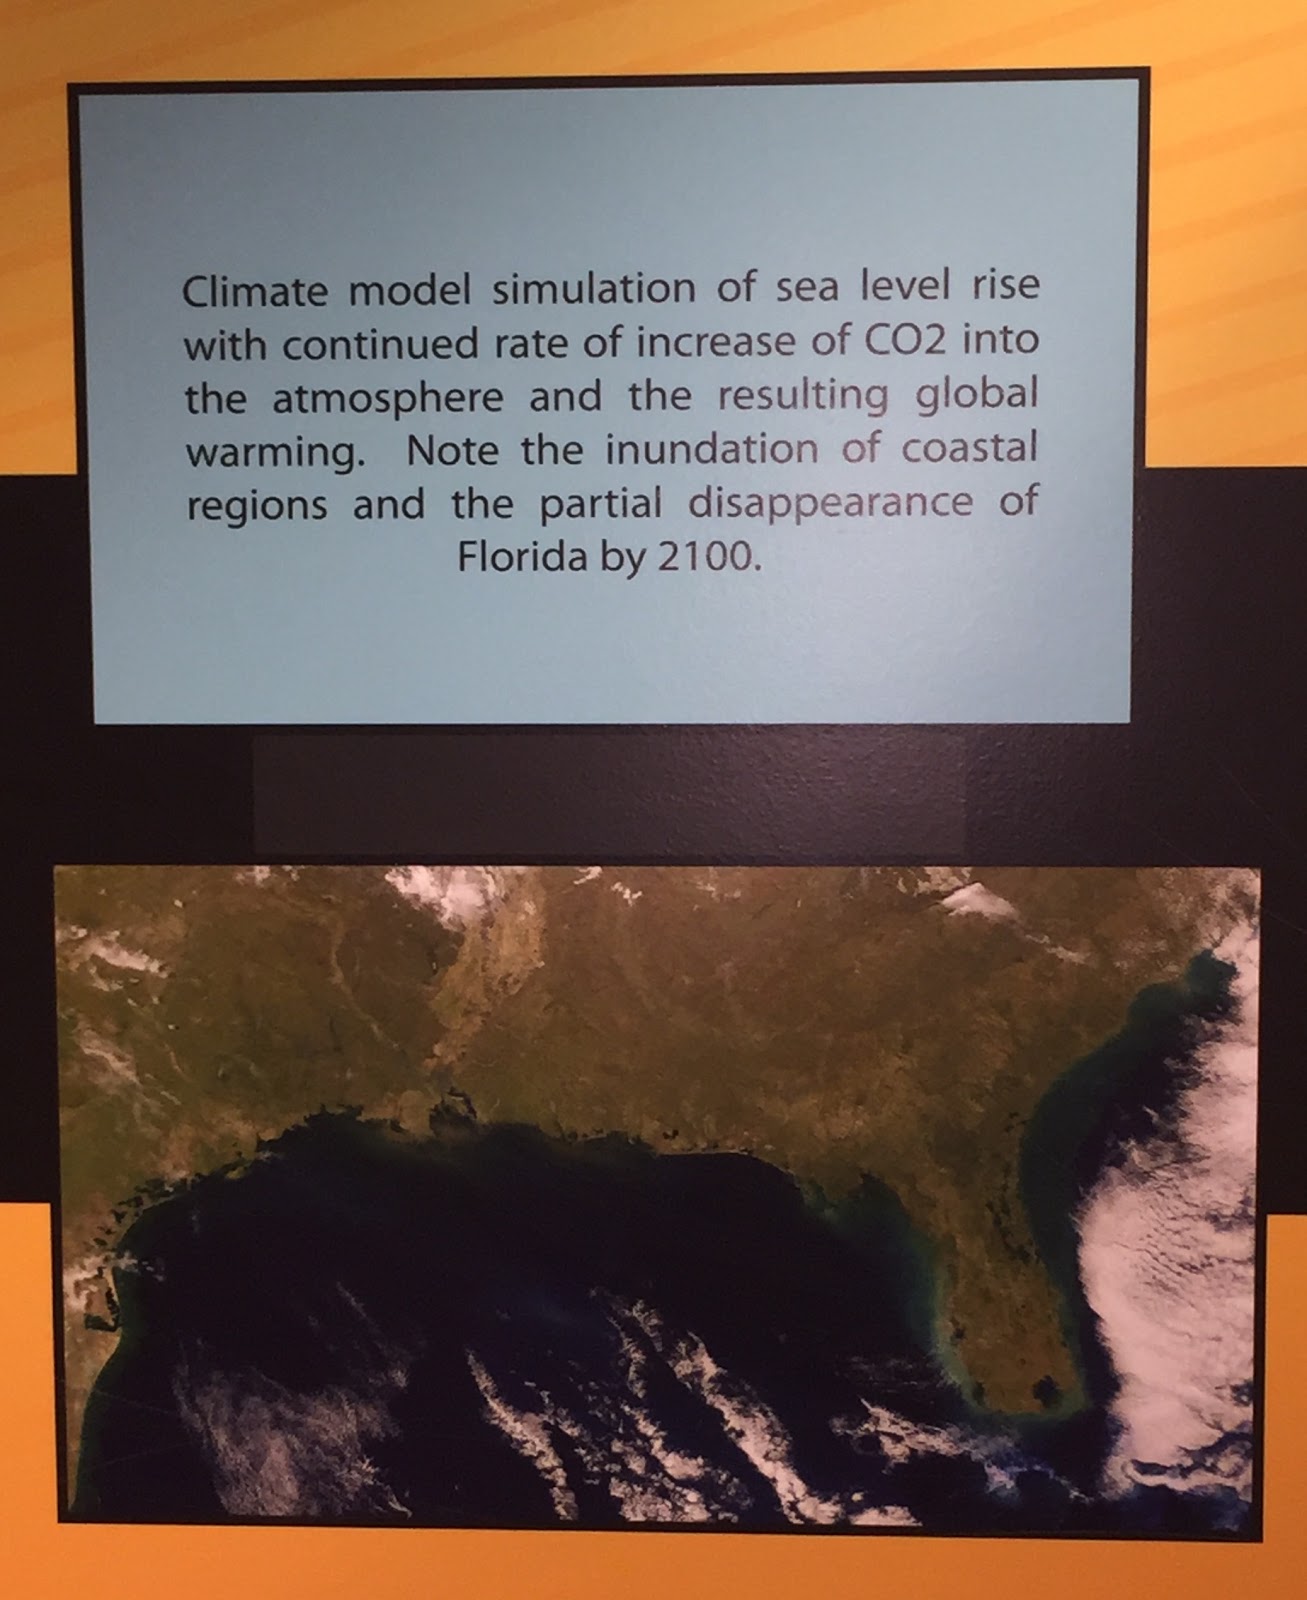
Sea levels are predicted to continue to rise due to the continued increase of carbon dioxide in the atmosphere, resulting in global warming.
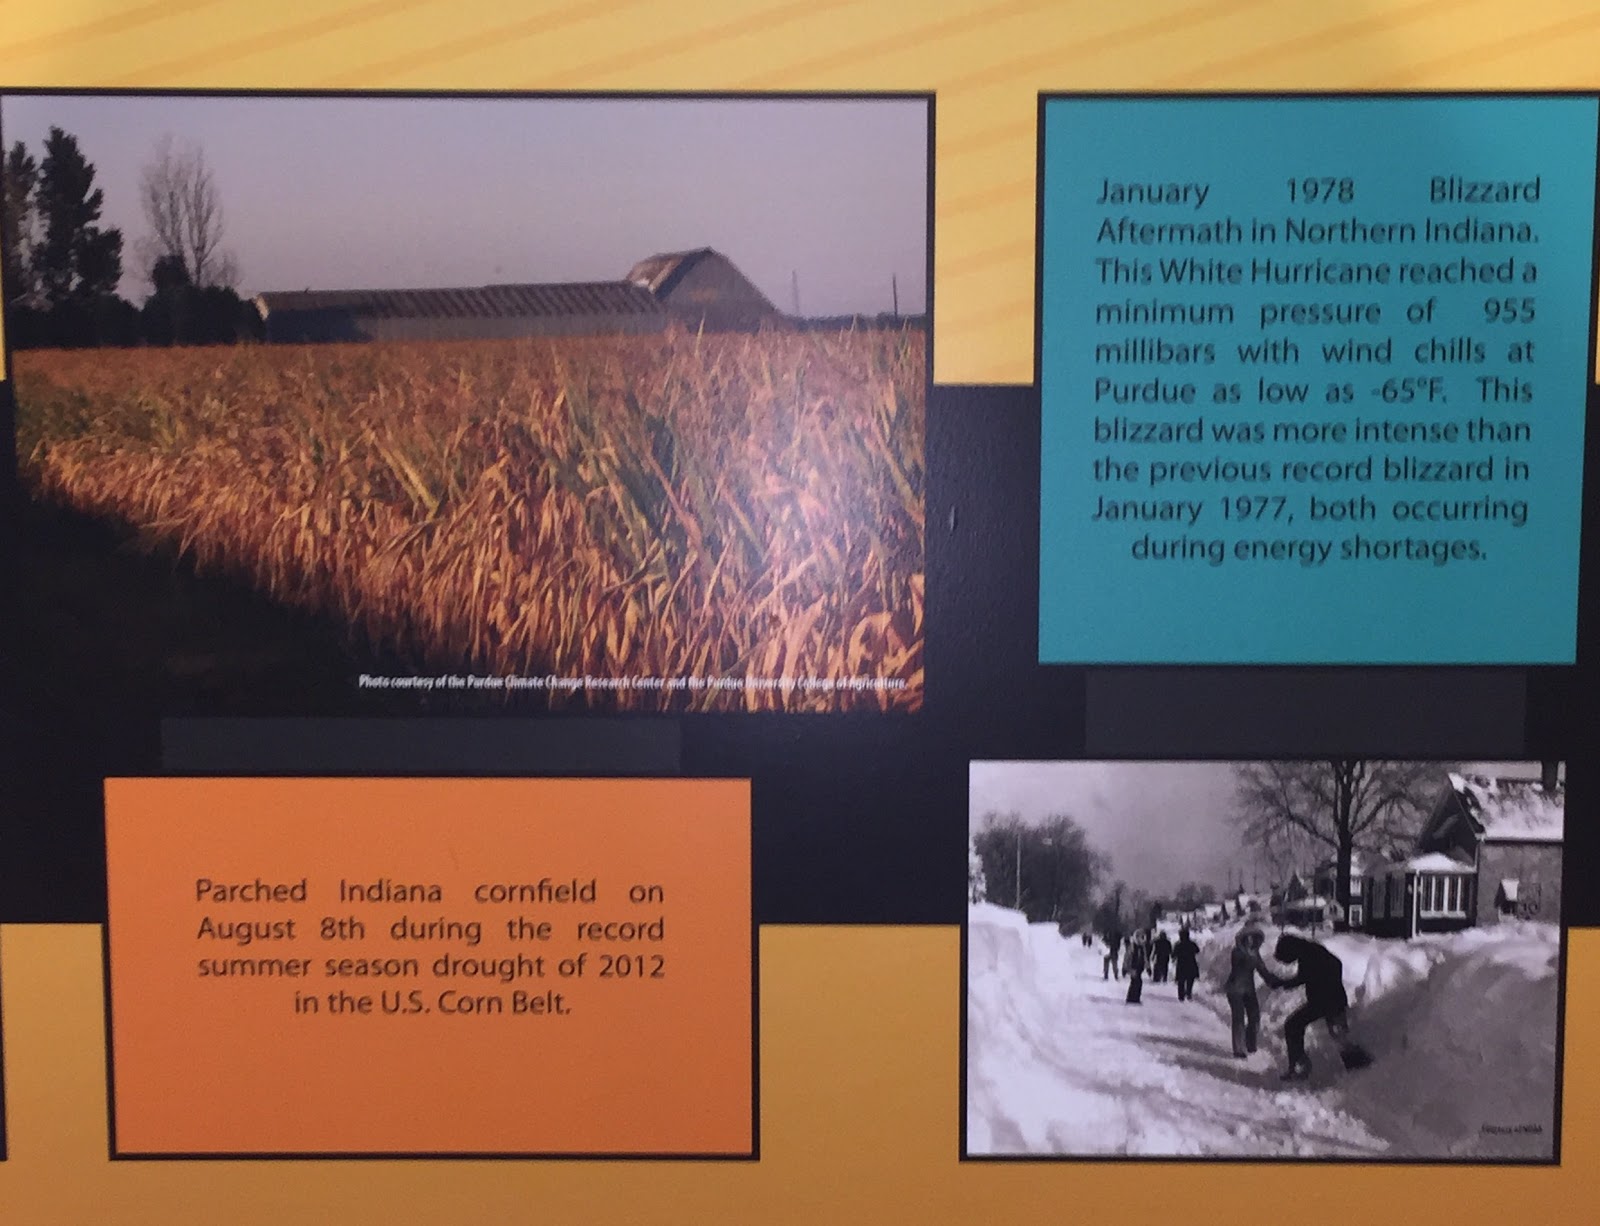
The photo in the bottom right shows the results of the January 1978 blizzard that plowed through Northern Indiana. Wind chills at Purdue got as low as negative sixty-five degrees Fahrenheit! The photo in the top left shows the record drought of 2012 that swept the Corn Belt.
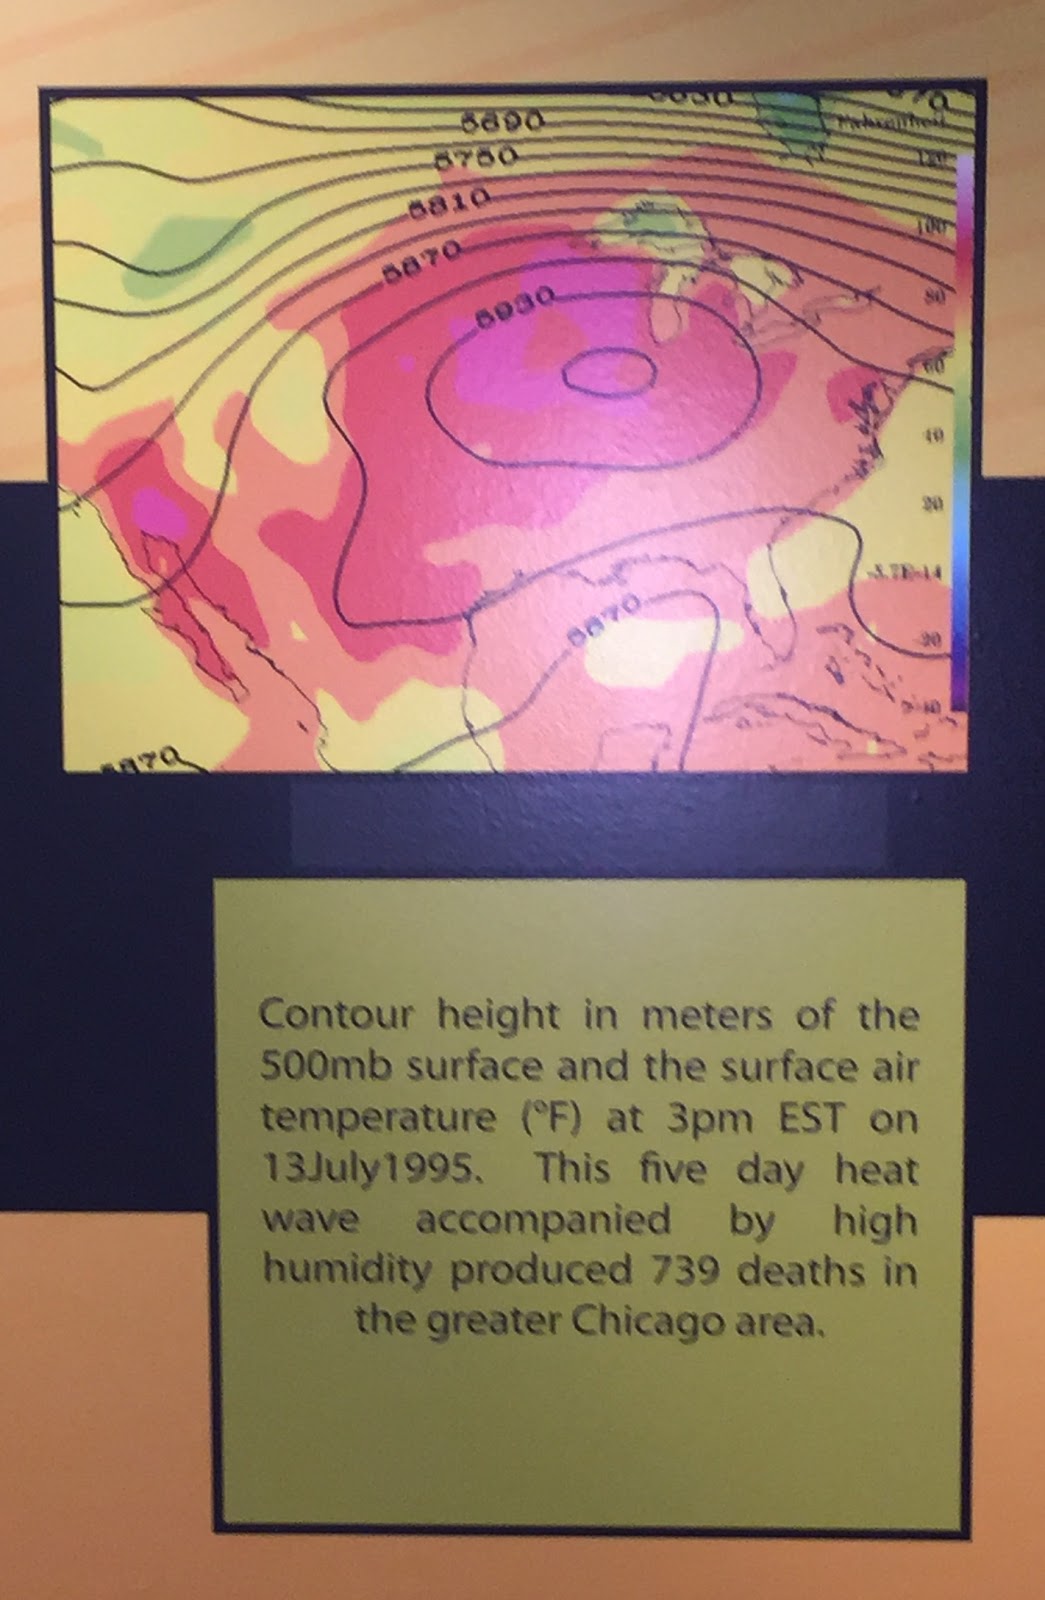
This is a 500mb map that depicts the surface air temperature on July 13, 1995. This heat wave killed 739 people in the greater Chicago area.
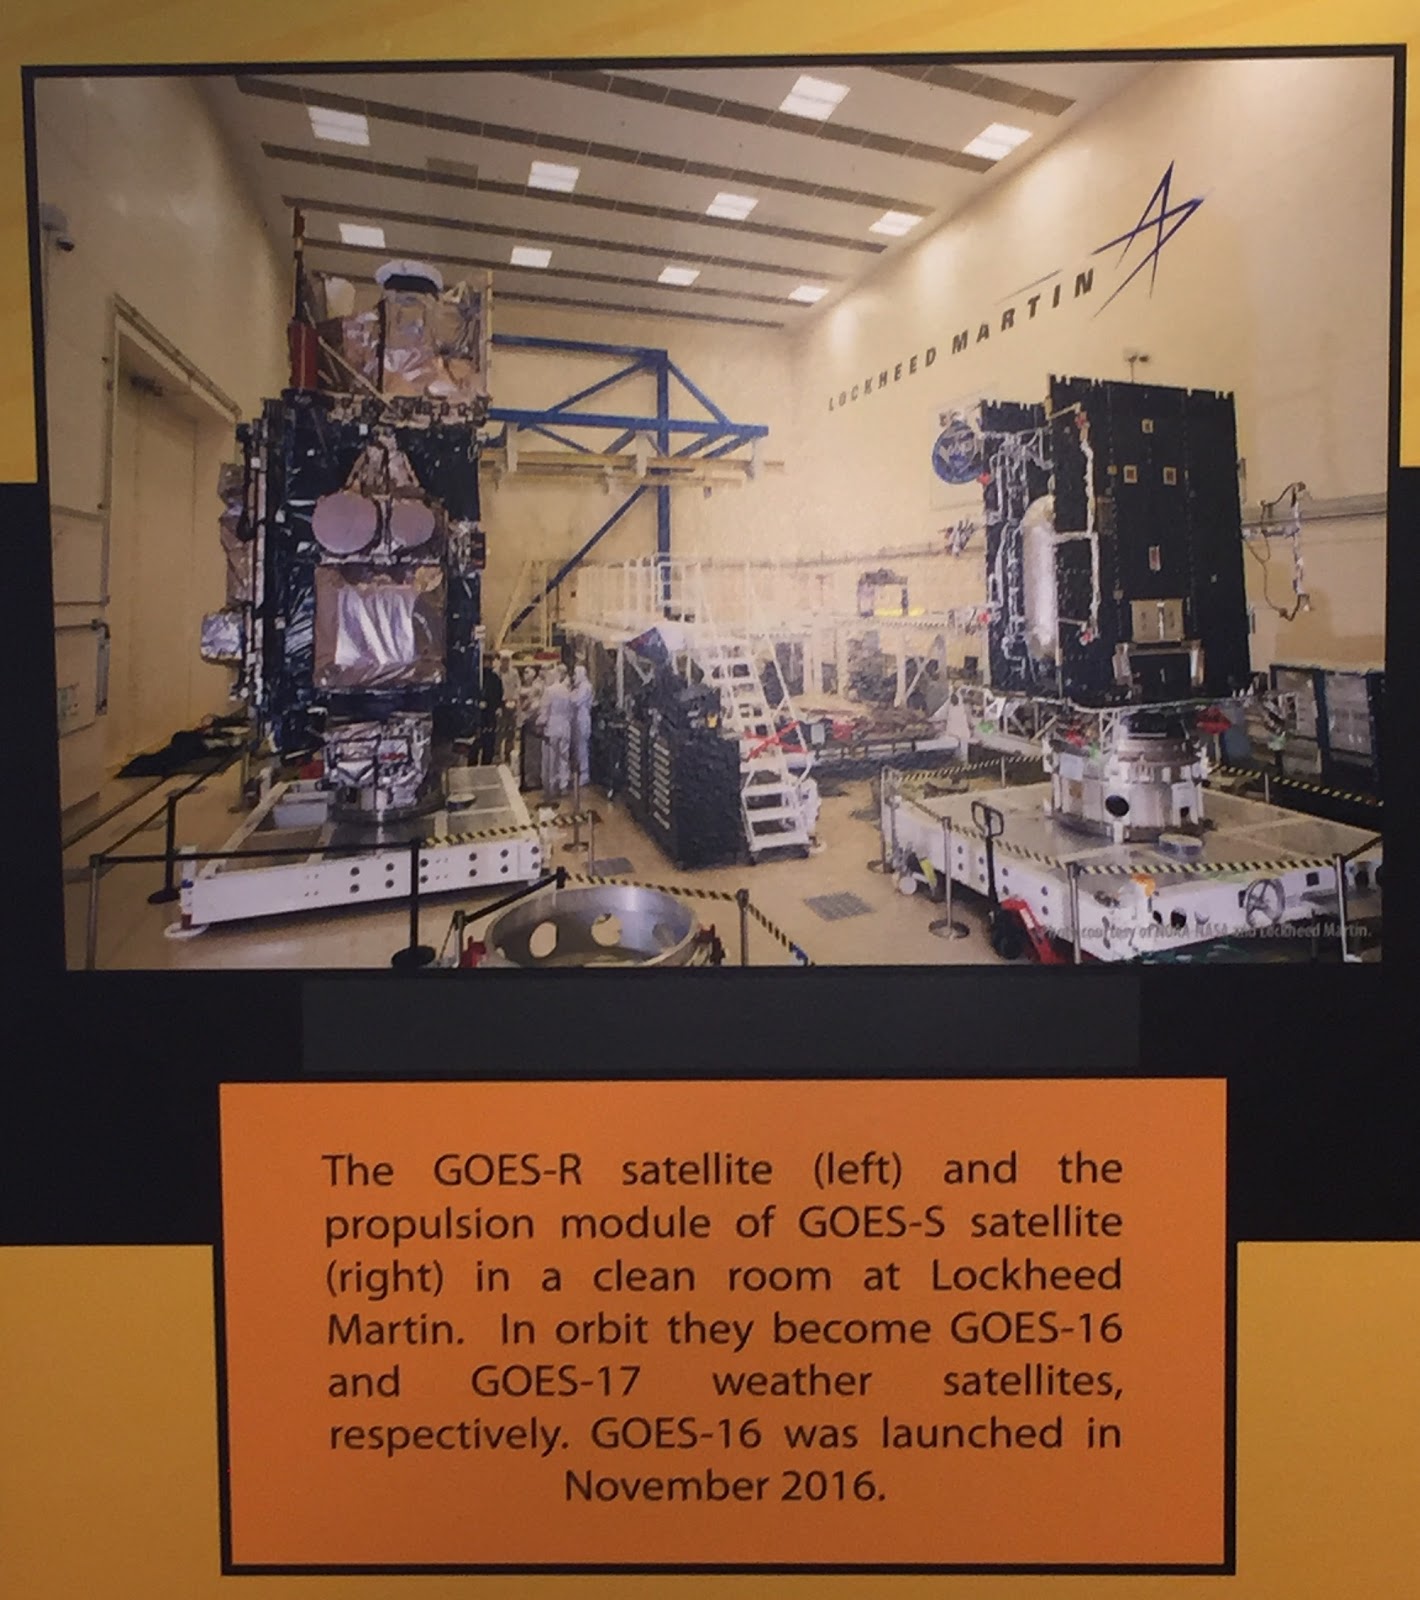
Weather satellites are important in showing real-time weather. In the photo above, the GOES-R satellite and the propulsion module of GOES-S satellite, when in orbit, become the GOES-16 and GOES-17 weather satellites.
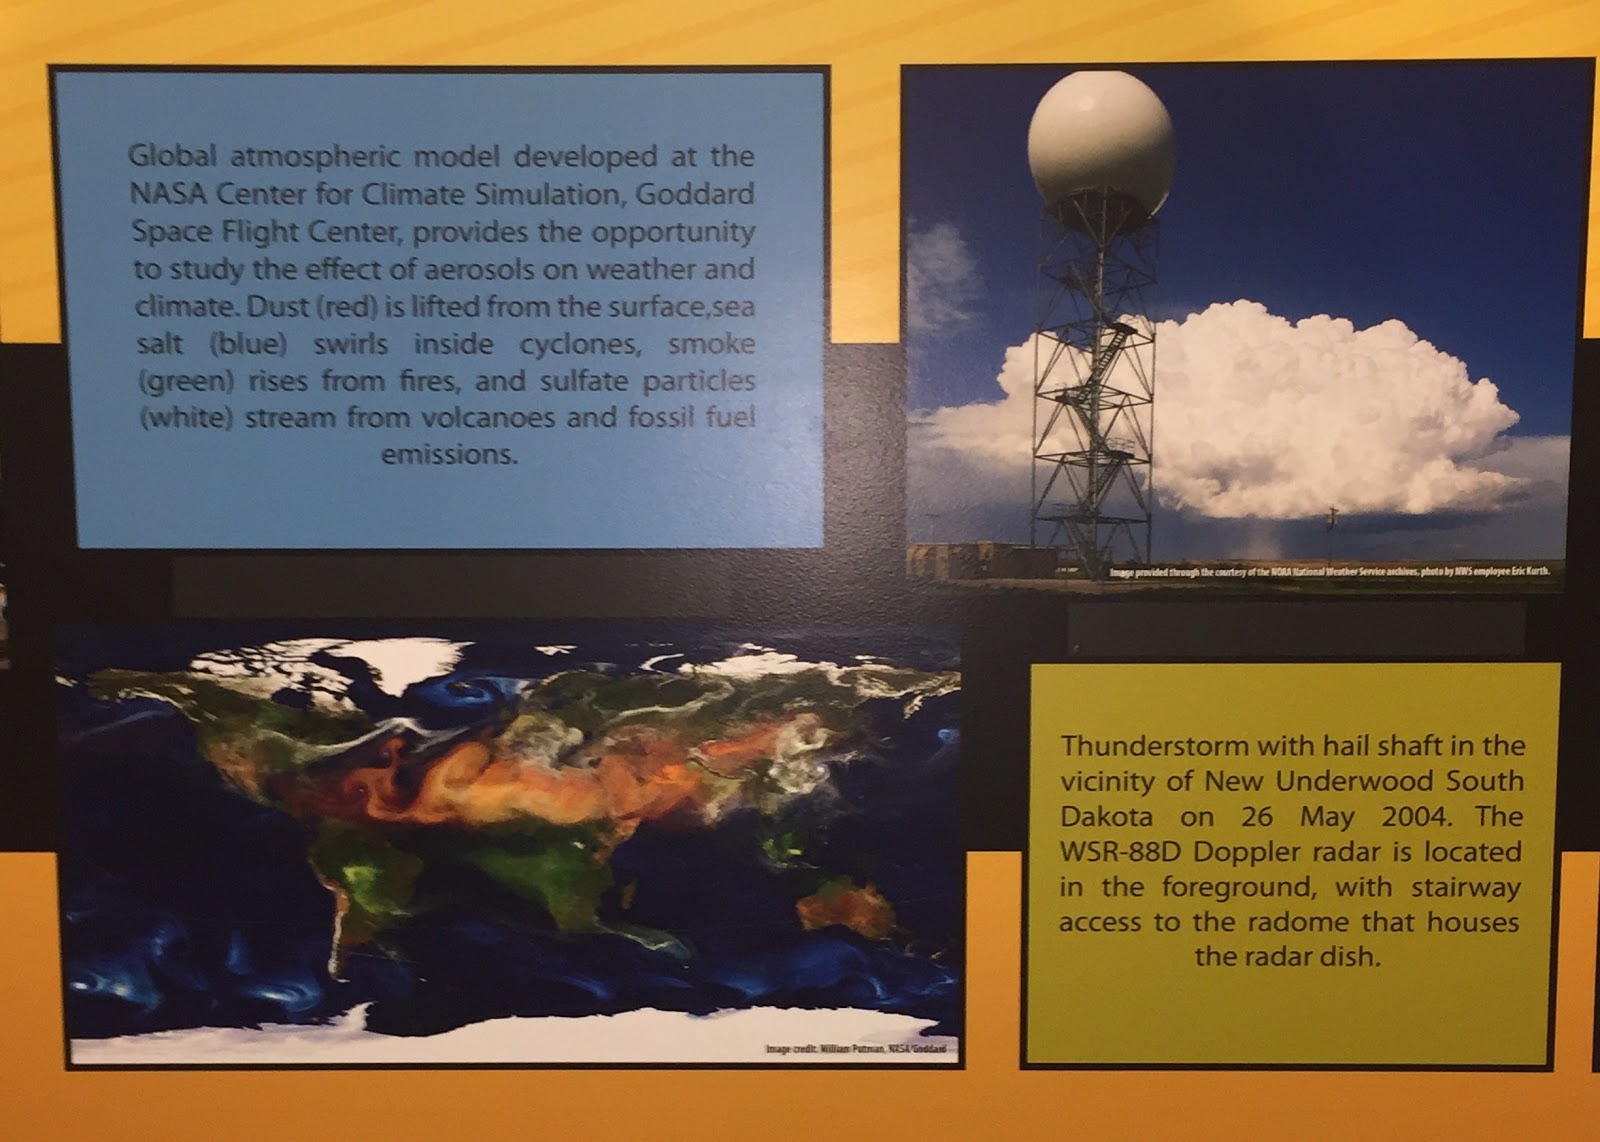
The bottom left photo depicts the various aerosols the planet experiences. The red is dust, blue is sea salt, green is smoke, and white is sulfate. The top right photo is the WSR-88D Doppler radar in front of a thunderstorm in South Dakota.

Various instruments can be used to collect data, including aircrafts (left) and weather balloons (right).
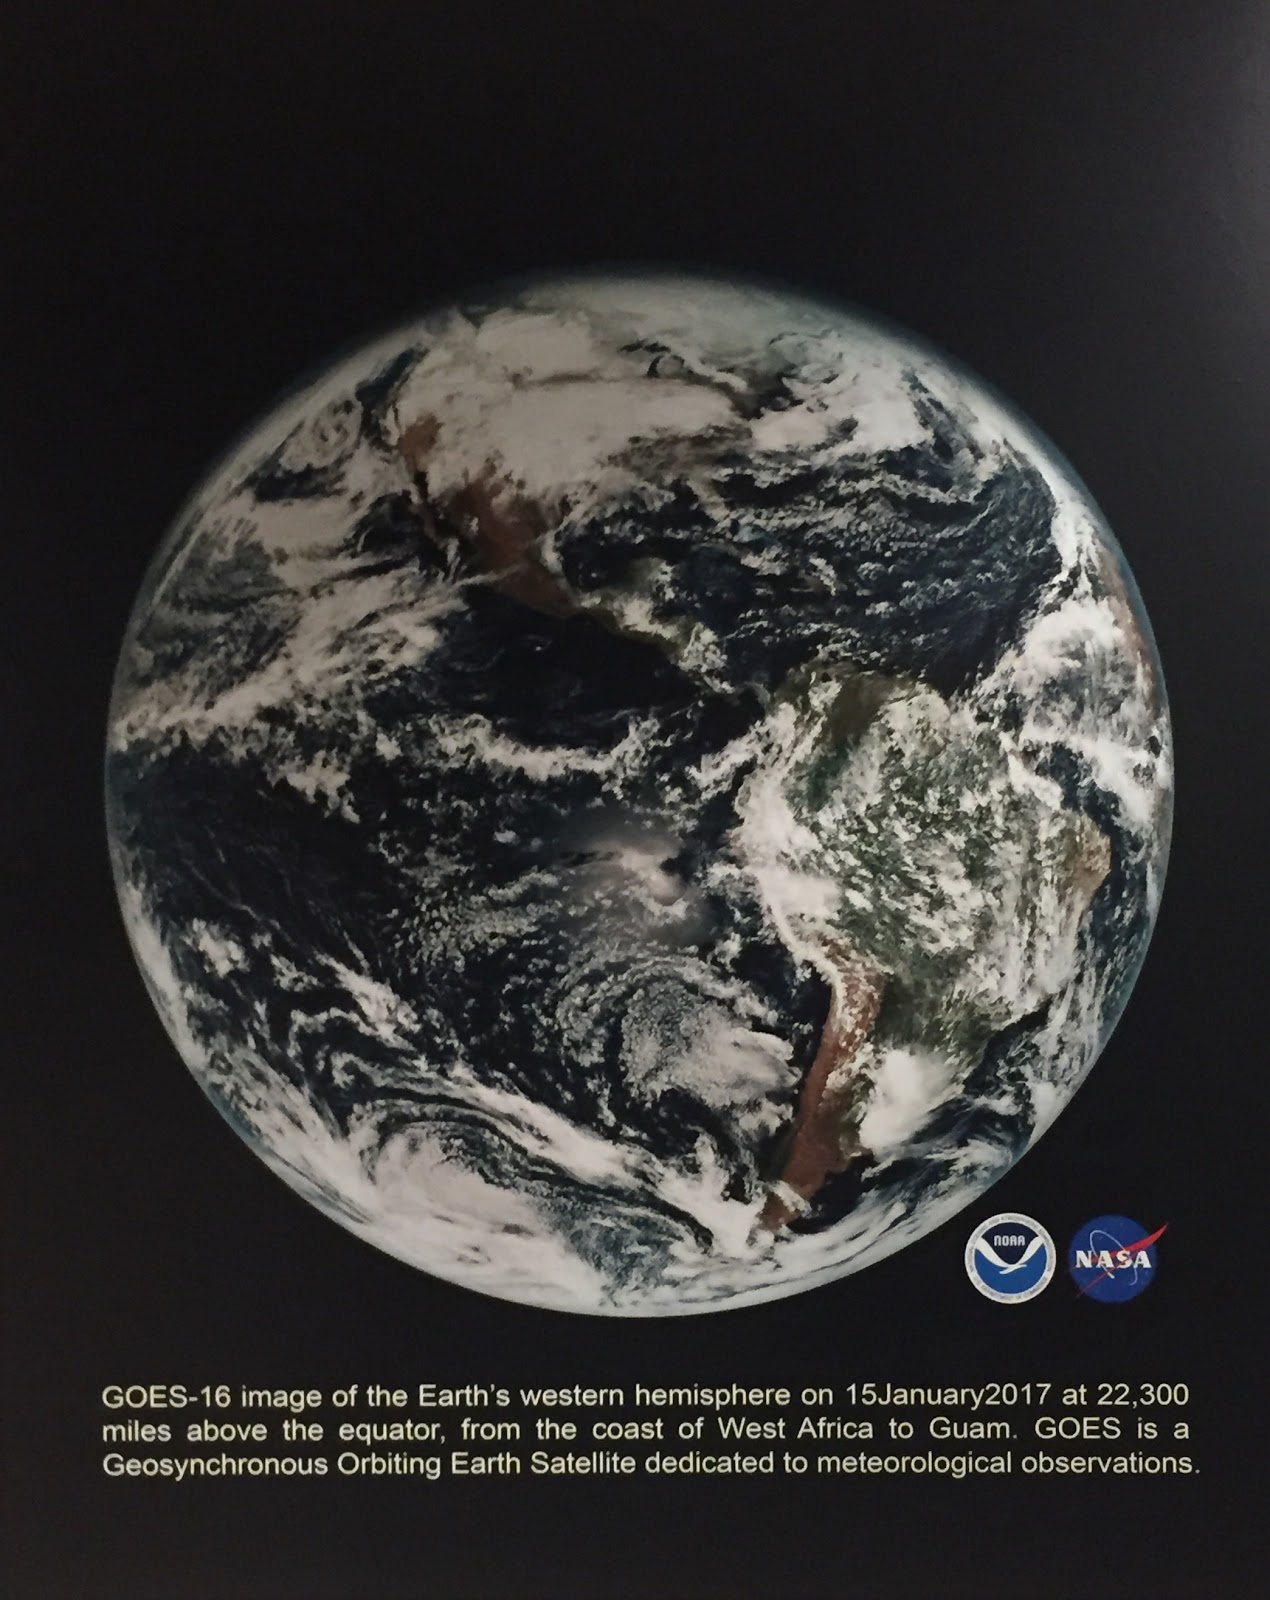
GOES-16 is a satellite that orbits Earth at the same rate that Earth rotates on its axis (geosynchronous). This means that the GOES-16 satellite will only ever “see” the same part of Earth. The above is the satellite’s photo of the Earth’s western hemisphere.
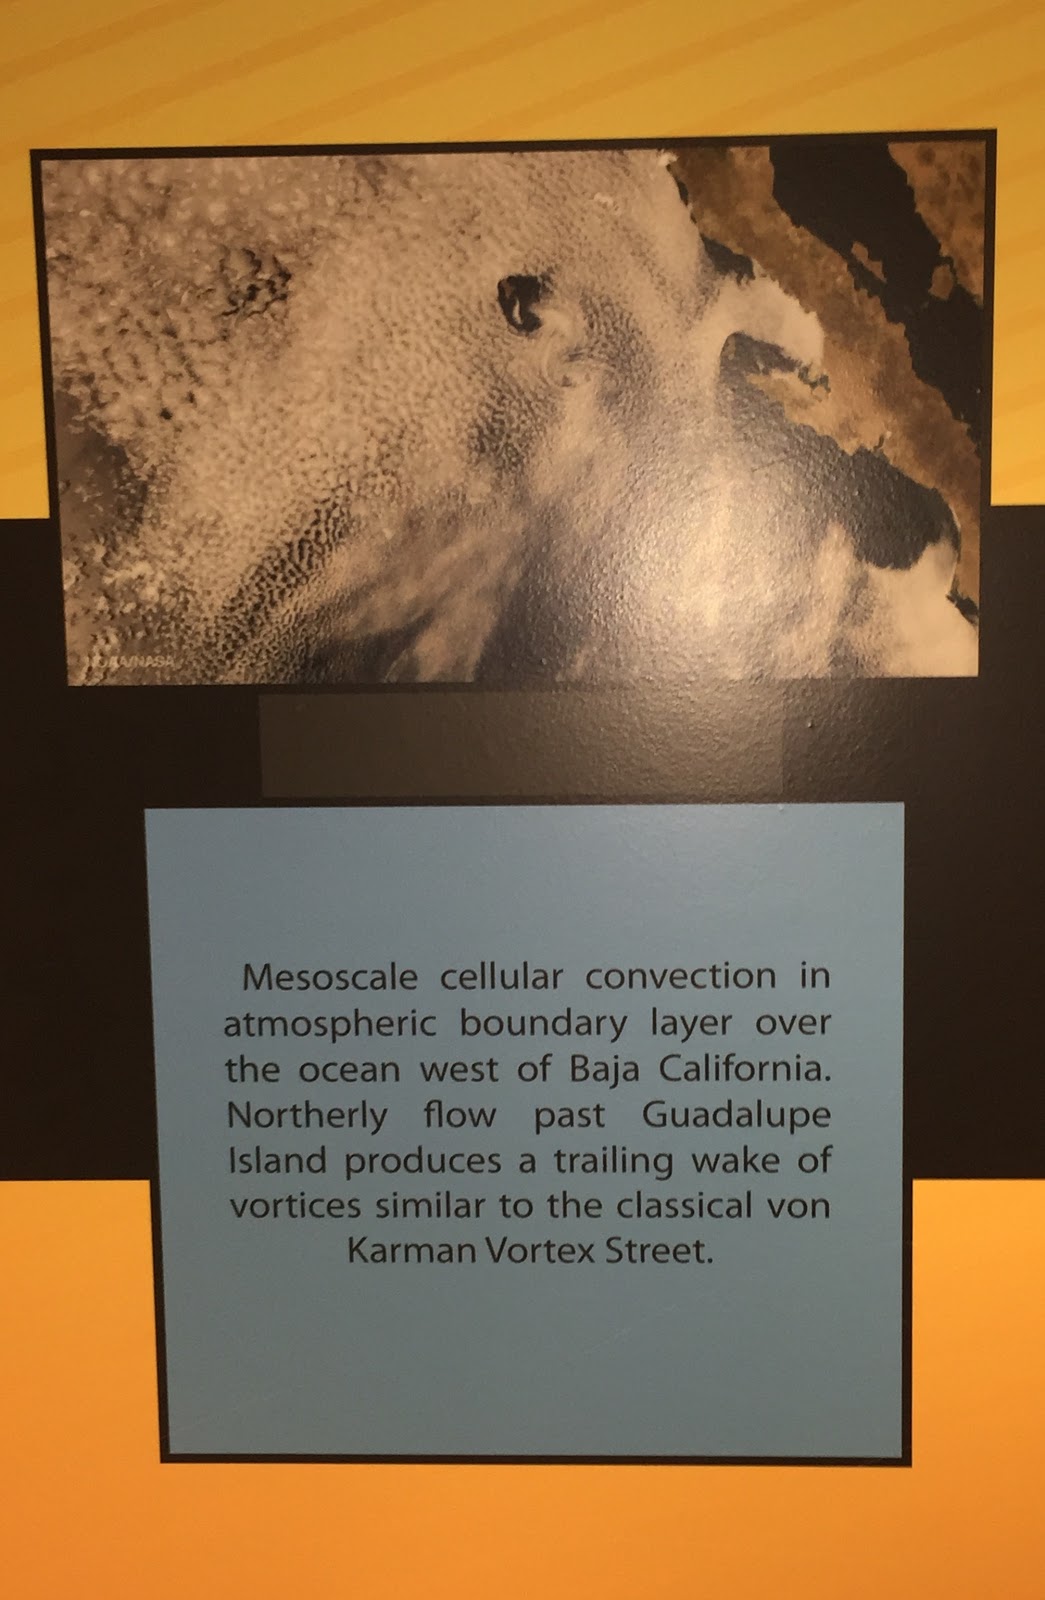
This is a photo of a mesoscale cellular convection over the ocean west of Baja California.
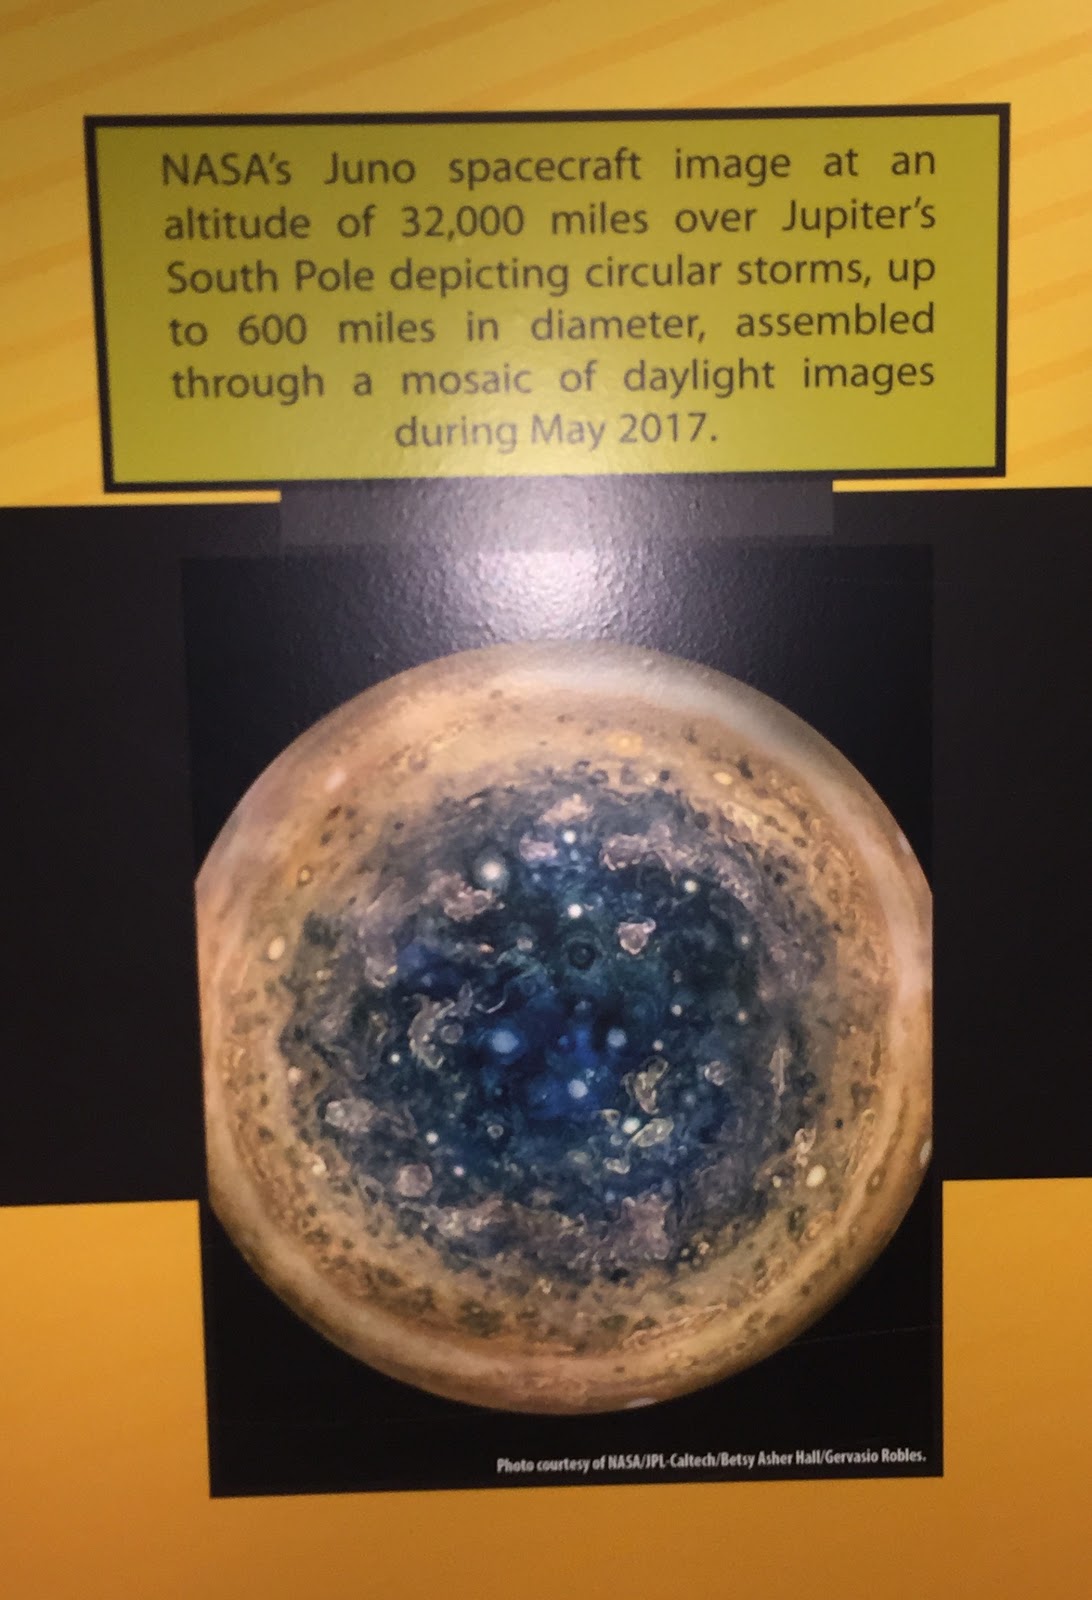
This is a photo of Jupiter’s South Pole that has circular storms that are up to six-hundred miles in diameter.
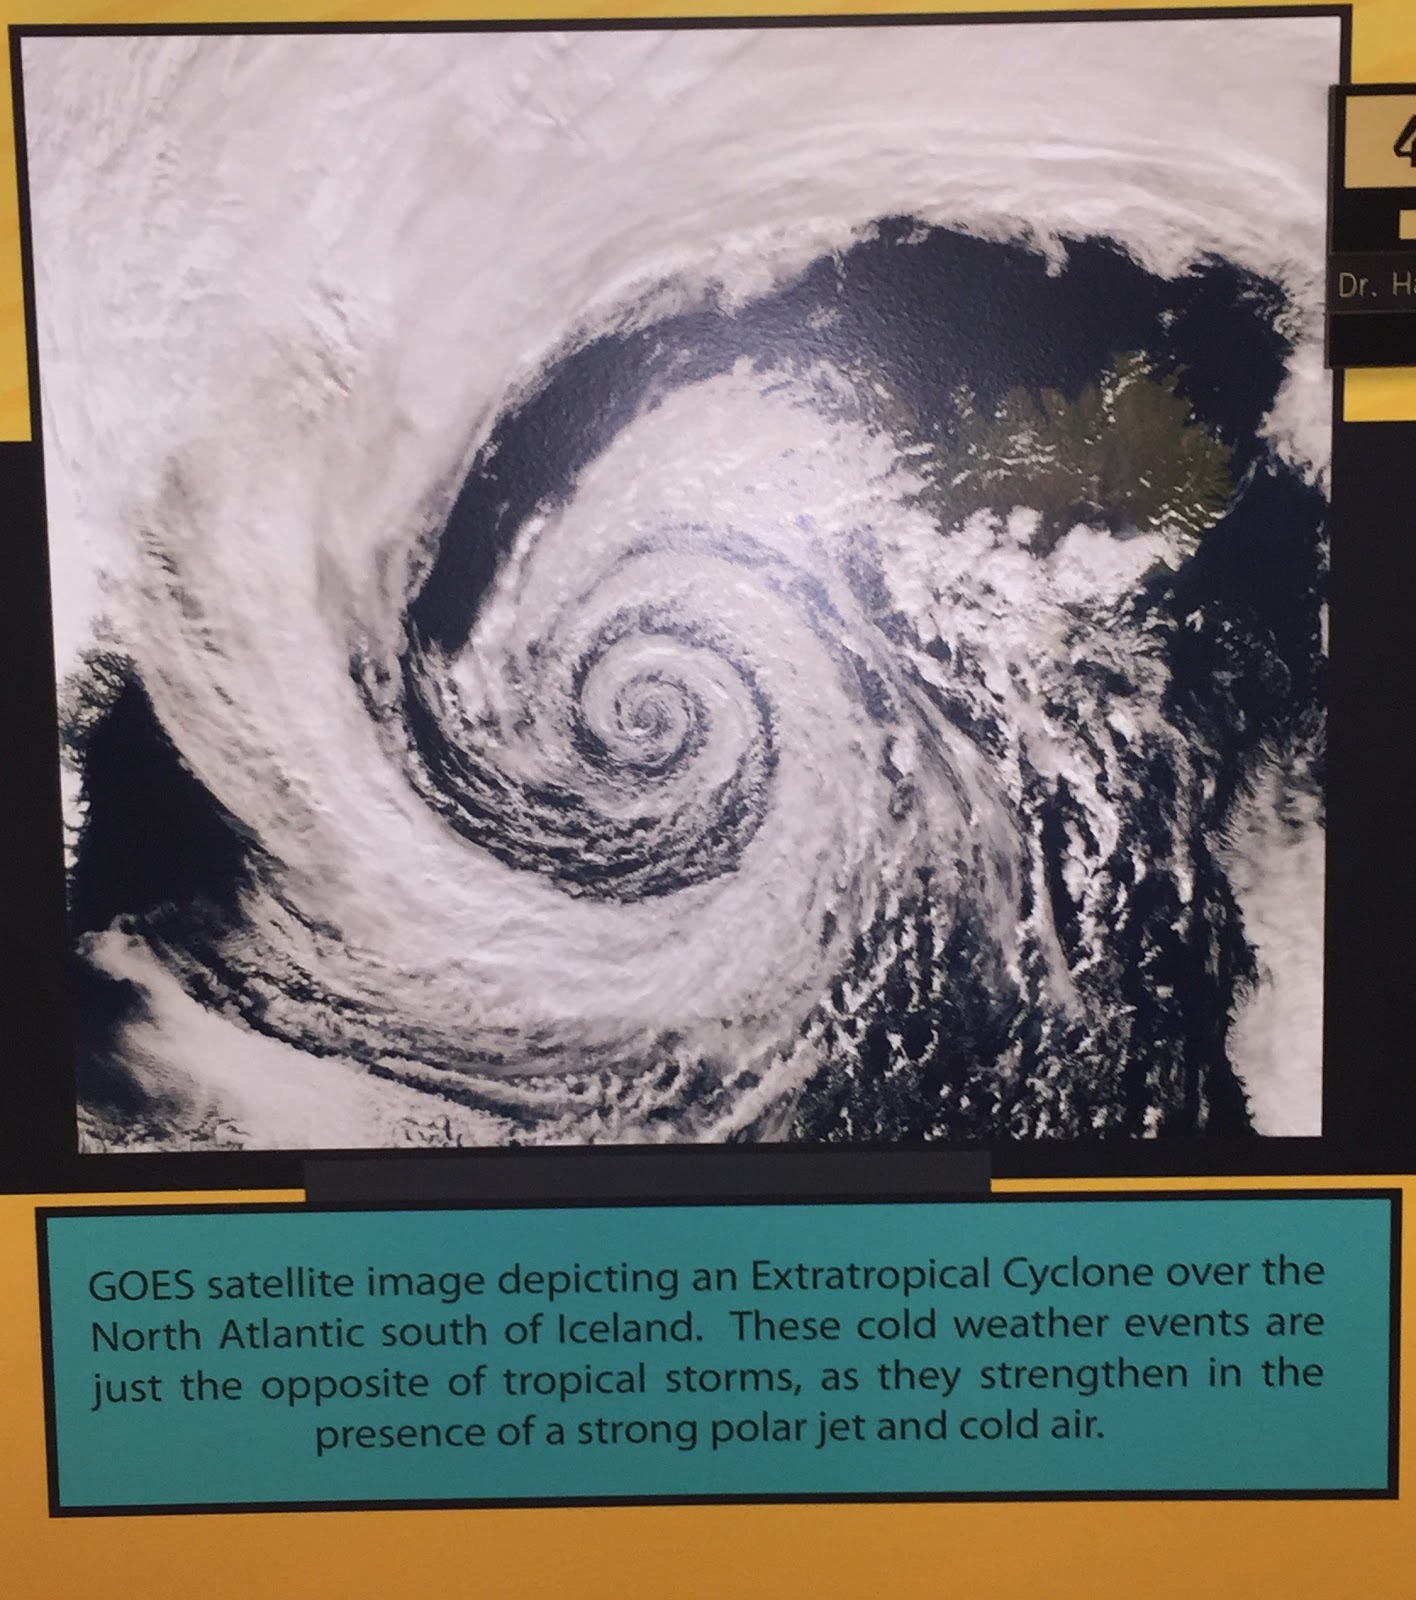
Unlike hurricanes which like warm air and a weak polar jet, an extratropical cyclone (depicted above) enjoys a strong polar jet and cold air. The one above is a photo of an Extratropical Cyclone over the North Atlantic south of Iceland.
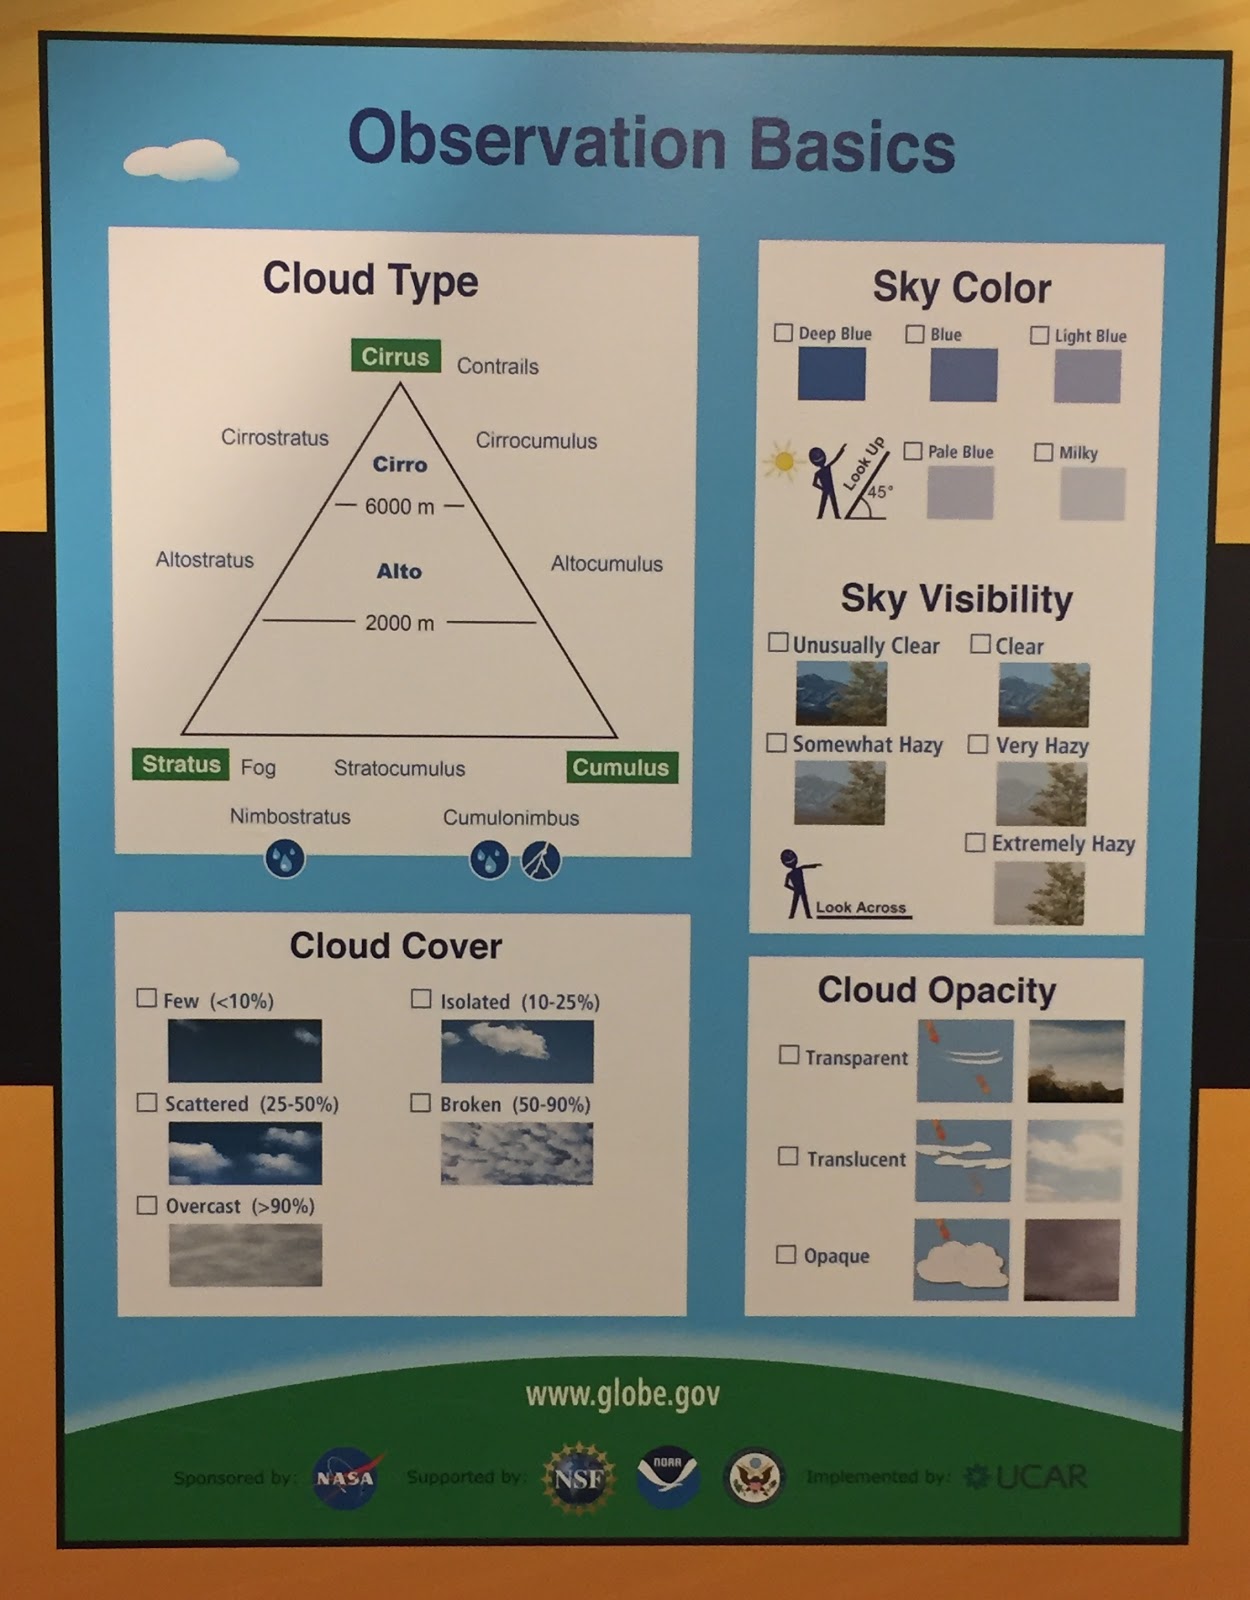
This photo depicts the observation basics, like how to tell the difference in cloud opacity, how many clouds define what cloud cover, what type of cloud is in the sky, what the sky color is, and the sky visibility.
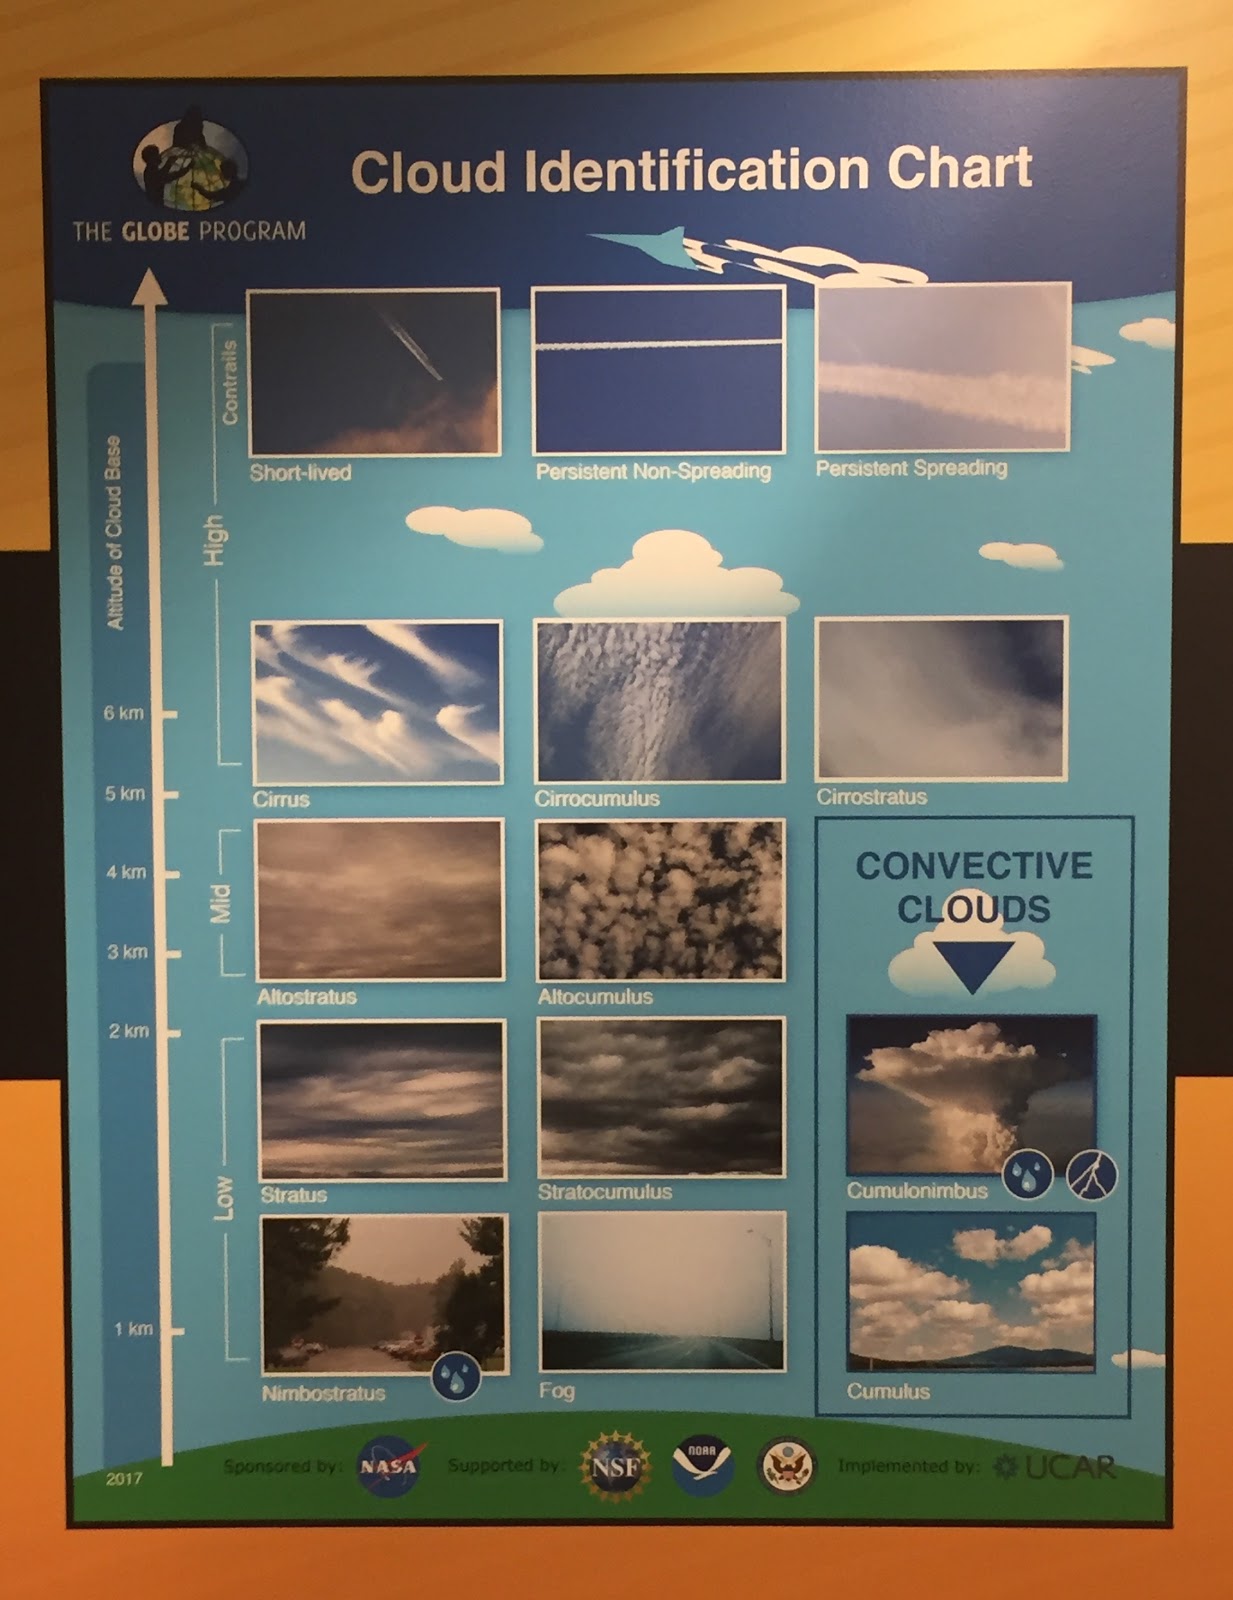
This helps identify what types of clouds are in the sky. For example, some low-level clouds include stratus and stratocumulus. Some mid-level clouds are altostratus and altocumulus, while some high-level clouds include cirrus, cirrocumulus, and cirrostratus.